Why Accessibility Matters
Creating and building access to math for all students is the essence of DeltaMath’s mission. Ensuring that our products are accessible to all, including students with disabilities, is at the forefront of both product and content design. To that end, the DeltaMath student application has been written to conform to the Web Content Accessibility Guidelines (WCAG) version 2.2.
Examples of accessibility features include:
- Screen readable content
- Alt text for static diagrams
- Braille printouts (for diagrams and graphs too complex to be meaningfully described in words)
- Video captioning
-
Read-aloud features and keyboard functionality that allow students to:
- Trace interactive graphs
- Plot points
- Create lines, line segments, and shaded graphs (i.e., inequalities)
- Move objects across the screen
- Reorder objects in a list
- High-contrast mode
- Keyboard shortcuts for common math symbols
The vast majority of DeltaMath content is fully accessible. That said, accessibility is an ongoing process, and there remain a number of interactive content pieces which, while keyboard accessible, are not accessible via screen reader. Other content pieces are accessible neither via keyboard nor via screen reader.
In certain instances we have identified accessible content pieces that cover roughly the same mathematical concept or procedures (to be assigned by the teacher as a suitable alternative). It remains our ambition to integrate logic directly into our software that would actively suggest alternatives in the case of inaccessible content, but for the time being we would advise teachers of students who use assistive technology to refer to the up-to-date list of inaccessible content and alternatives found here.
We are continually working to expand student access. Please email us at support@deltamath.com with any questions, comments, suggestions, or concerns.
Screen Reader Recommendations
We recommend the following screen readers for users, depending on their device.
Screen Reader Settings
Note that if a VoiceOver user is using Quick Nav, it may interfere with the arrow key commands associated with our graph interactivity features. That being the case, we recommend turning off Quick Nav (Settings → Accessibility → VoiceOver → Open VoiceOver utility → Commanders → Quick Nav) for a better experience.
Accessibility Features
Static Images
DeltaMath problems often ask students to interpret an image, which could be a graph, diagram or geometric figure. In order to ensure that all users have access to a given image, we have employed three different strategies depending on the complexity of that image.
» Alternative Text
For some images, such as a simple geometric figure or a visual representation of an algebraic equation, we provide alternative text for screen reader users. In those cases, students hear a detailed description of the image when they navigate to it on the page.
» Trace Mode
If the problem requires students to visually interpret a graphed function, we have a tool called Trace Mode. Students using a screen reader can press the arrow keys to "trace" the points that comprise the graphed function at a regular interval (similar to "trace mode" on a graphing calculator). If a user encounters a key point on the graph that may be pertinent to solving the problem, such as an intercept or a local maximum or minimum, the user will hear the phrase “Key Point” as an identifier before the coordinates are announced.
Instructions:
- Navigate to the graph.
- Press T to enter trace mode.
- Use the LEFT ARROW and RIGHT ARROW keys to trace the graph and hear the coordinate points read.
- For two graphed functions on the same set of axes, use the UP ARROW and DOWN ARROW keys to switch between the functions.
- To leave trace mode, press TAB to navigate to the next element on the screen.
» Braille Printouts
Some graphs and images on DeltaMath are too complex to describe in words or interpret with Trace Mode. In those cases, the screen reader will provide instructions for accessing a tactile, or Braille, version of the image, for potential reproduction on a tactile printer. To see and download the tactile preview, press SHIFT + CONTROL + U for UEB or SHIFT + CONTROL + E for Nemeth.
Interactive Content
DeltaMath has a variety of interactive content pieces embedded within a number of our activities. Here are some common interactions a student may experience and descriptions of how they can be operated using a keyboard and/or screen reader.
Note: The instructions for each tool are provided to students via screen reader as they are presented with/solve problems. In certain cases, we also provide additional instructions for keyboard users as visible text on the problem.
» Point Plotter
In order to plot points without a mouse and/or with a screen reader, we offer a tool called Point Plotter. Students using a screen reader will be able to move the point plotter tool and hear their current position on the graph read aloud. Additionally, as students plot points, navigate to previously plotted points, and delete points, the screen reader will announce each change to the graph in real time.
Instructions:
- Navigate to the graph.
- Press TAB to launch the point plotter tool.
- Use the ARROW keys to navigate the point plotter around the graph.
- Press ENTER to plot a point.
- Press ENTER again to delete it.
- Access previously plotted points by pressing TAB and SHIFT + TAB (all plotted points are tabbable elements).
» Plot Lines, Line Segments and Linear Inequalities
In order to plot a line, line segment or linear inequality without a mouse and/or with a screen reader, the user will need to plot two points using the Point Plotter tool. Students using a screen reader will be able to move the point plotter tool. As the points are moved, their current position on the graph will be read aloud. Additionally, as students plot points, navigate to previously plotted points, and delete points, the screen reader will announce each change to the graph in real time.
Instructions:
- Navigate to the graph.
- Press TAB to launch the point plotter tool.
- Use the ARROW keys to navigate the point plotter around the graph.
- Press ENTER to plot a point.
- Press ENTER again to delete it.
- Plot a second point to generate a line, line segment or linear inequality.
- Access previously plotted points by pressing TAB and SHIFT + TAB.
» Object Mover
Many of the graphs and widgets on DeltaMath have movable objects, such as points, functions, arrows, bars of a bar graph, etc. In order to answer the question, the student will need to move the object to an appropriate position. Students using a screen reader will hear the current position of the movable object read aloud. As they move the object, the screen reader will announce all changes to the graph in real time.
Instructions:
- Navigate to the graph.
- Press TAB to grab the movable object.
- Use the ARROW keys to move the object.
- For multiple objects on the same graph that need to be moved, use TAB and SHIFT + TAB to grab the other objects.
» Reordering Lists with Drag and Drop
DeltaMath includes some content where a list of items may need to be reordered. Screen readers will both describe the instructions and identify the items, as well as their current position in the list.
Instructions:
- Press TAB to navigate to an item to reorder.
- Press ENTER to grab the item.
- Press the ARROW keys to move the item in the list.
- Press ENTER again to drop the item.
- Press ESC to cancel a reordering once an item has been grabbed.
Closed Captions
All help videos for students have closed captions, which students can turn on by pressing the three dots in the bottom right corner of the video and selecting “captions”.
Increased Contrast Mode
| For users that need support to see colors against a white background, they can turn on the “increased contrast mode” setting on the profile page. When turned on, lighter colors that may be difficult to see will show darker for all problems. Once “increased contrast mode” is toggled on, the user’s preference will be saved to their account. | 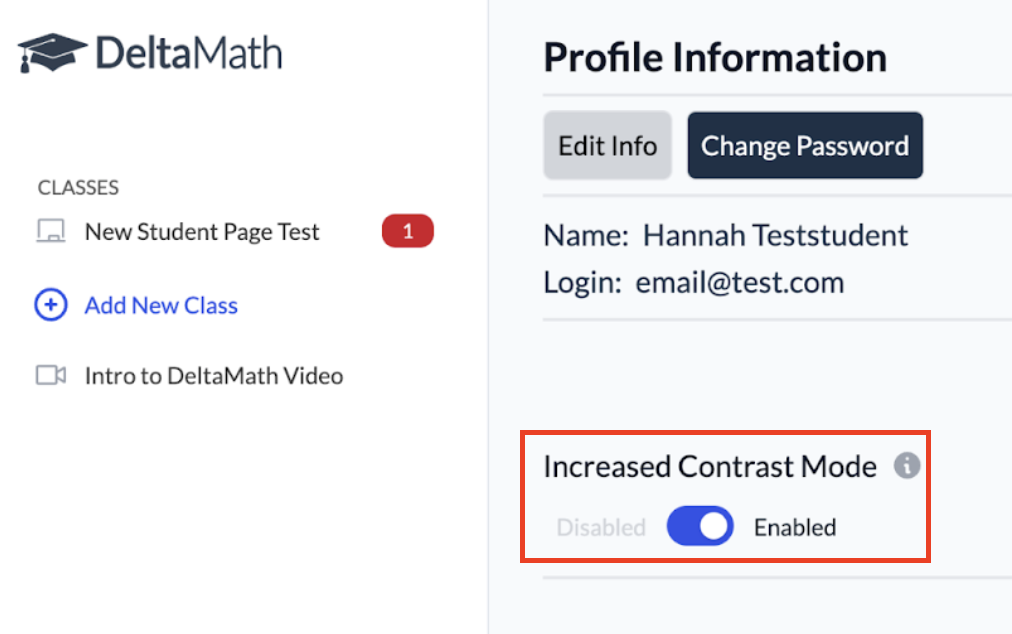 |
|
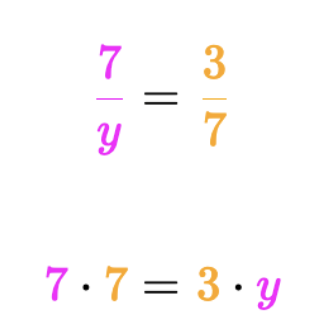
Here is an example of a problem before enabling increased contrast mode. |
 |
| Here is the same problem before after enabling increased contrast mode. | 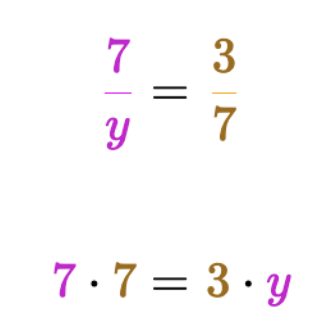 |
Keyboard Shortcuts for Math Input Boxes
Our math input boxes use an editor called MathQuill, designed to make typing math easy. While DeltaMath provides an onscreen keyboard with ARIA markup, we highly recommend that students using a screen reader familiarize themselves with commonly used keyboard shortcuts for typing symbols. Typing the shortcut will be significantly faster than tabbing through the onscreen keyboard to locate the correct symbol.
Common Symbols and Shortcuts
Name |
Keyboard Shortcut |
Example of Shortcut |
Example of Symbol |
| Exponent | 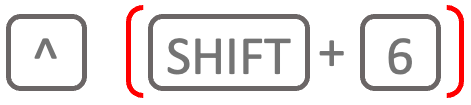 |
x^2 |
 |
| Subscript |  |
a_(n - 1) TAB |  |
| Less than or equal to |  |
x le 2 |  |
| Greater than or equal to |  |
x ge 2 |  |
| Fraction |  |
1/2 |  |
| Square Root |  |
sqrt 37 |  |
| Nth Root |  |
nthroot 3 TAB 8 |  |
| Summation |  |
sum n=1 TAB 5 |  |
| Infinity |  |
(0, infty) |  |
| Pi |  |
2pi |  |
| Plus Minus |  |
x pm sqrt 5 |  |
| Multiply |  |
a * b |  |
| Approximately |  |
x approx 5.1 |  |
| Union |  |
(-5, 0) cup (2, 10] |  |
| Theta |  |
sin(2theta) |  |
| Sine |  |
sin(x) |  |
| Cosine |  |
cos(37) |  |
| Tangent |  |
tan(pi/2) |  |
| Arcsine |  |
arcsin(1/2) |  |
| Arccosine |  |
arccos(x) |  |
| Arctangent |  |
arctan(x) |  |
| Secant |  |
sec(pi/4) |  |
| Cosecant |  |
csc(30) |  |
| Cotangent |  |
cot(90) |  |
| Limit |  |
lim x |  |
| Prime |  |
f' |  |
| Double Prime |  |
f" |  |
| Logarithm (Base 10) |  |
log(1000) |  |
| Logarithm (Base other than 10) |  |
log _ 2 TAB 32 |  |
| Natural Logarithm |  |
ln(x) |  |
| Absolute Value |  |
|a| |  |
| All Real Numbers |  |
(-infty,infty) |
 |
| Does Not Exist |  |
||
| Answer |  |
LaTeX for More Math Symbols
For other math symbols, students can use the following LaTeX commands. After typing the command, press ENTER to insert the symbol into the math input box.
Name |
Keyboard Shortcut |
Ex of Shortcut |
Ex of Symbol |
| Integral |  |
\int ENTER 1 TAB infty TAB |
 |
| Undefined |  |
 |
|
| Empty Set |  |
 |
|
| Intersection |  |
A \cap ENTER B |  |
| Degree |  |
37 \degree ENTER |  |
| Cannot Be Determined |  |
 |
- accessibility
- read aloud
- text-to-speech
Was this article helpful?