
Table of Contents
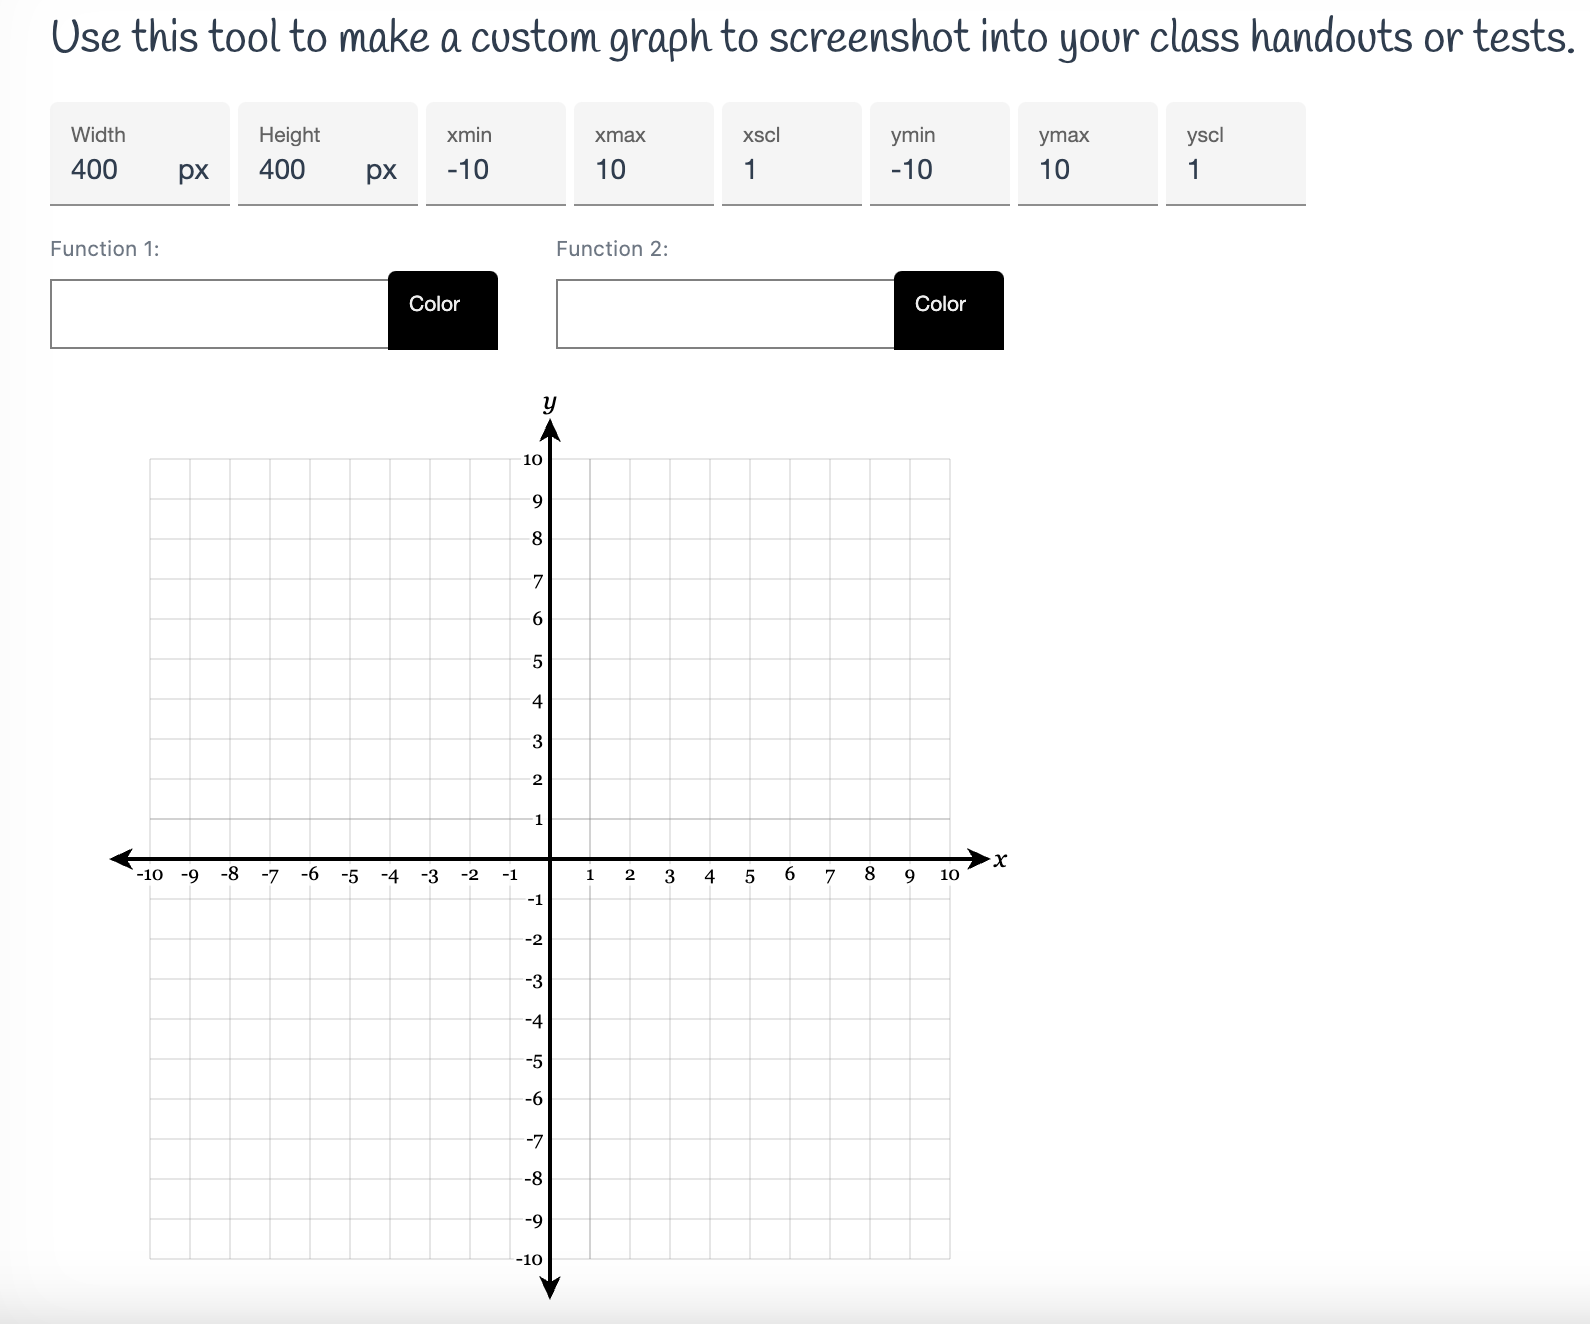
Create a Custom Graph
With the DeltaMath custom graph creator, you can create various types of function graphs for your DeltaMath teacher-created questions or class resources.
Graph Equations
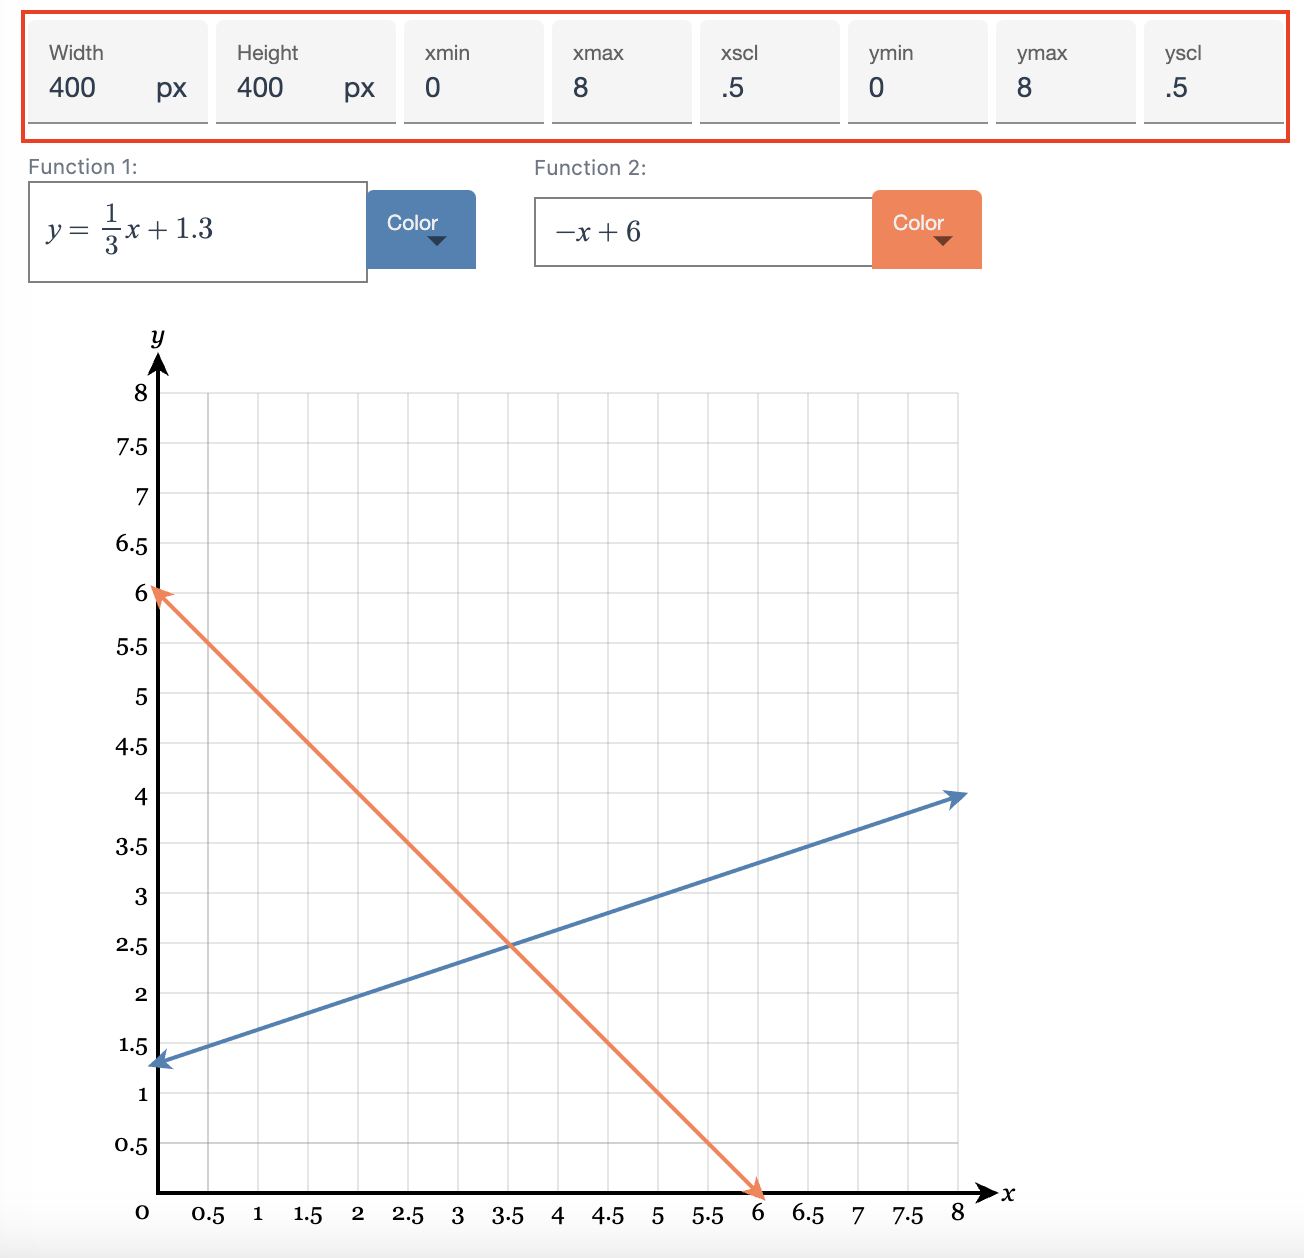
| You can graph up to two equations at a time by entering them into the boxes for “Function 1” and “Function 2.” | 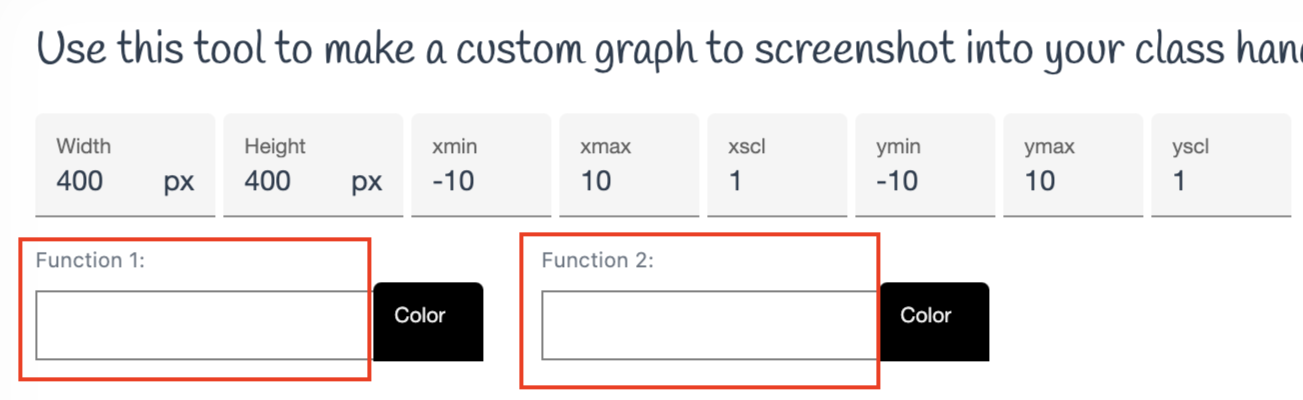 |
| By default, equations are graphed in black. To select a different color, use the “Color” drop-down menus to the right. | 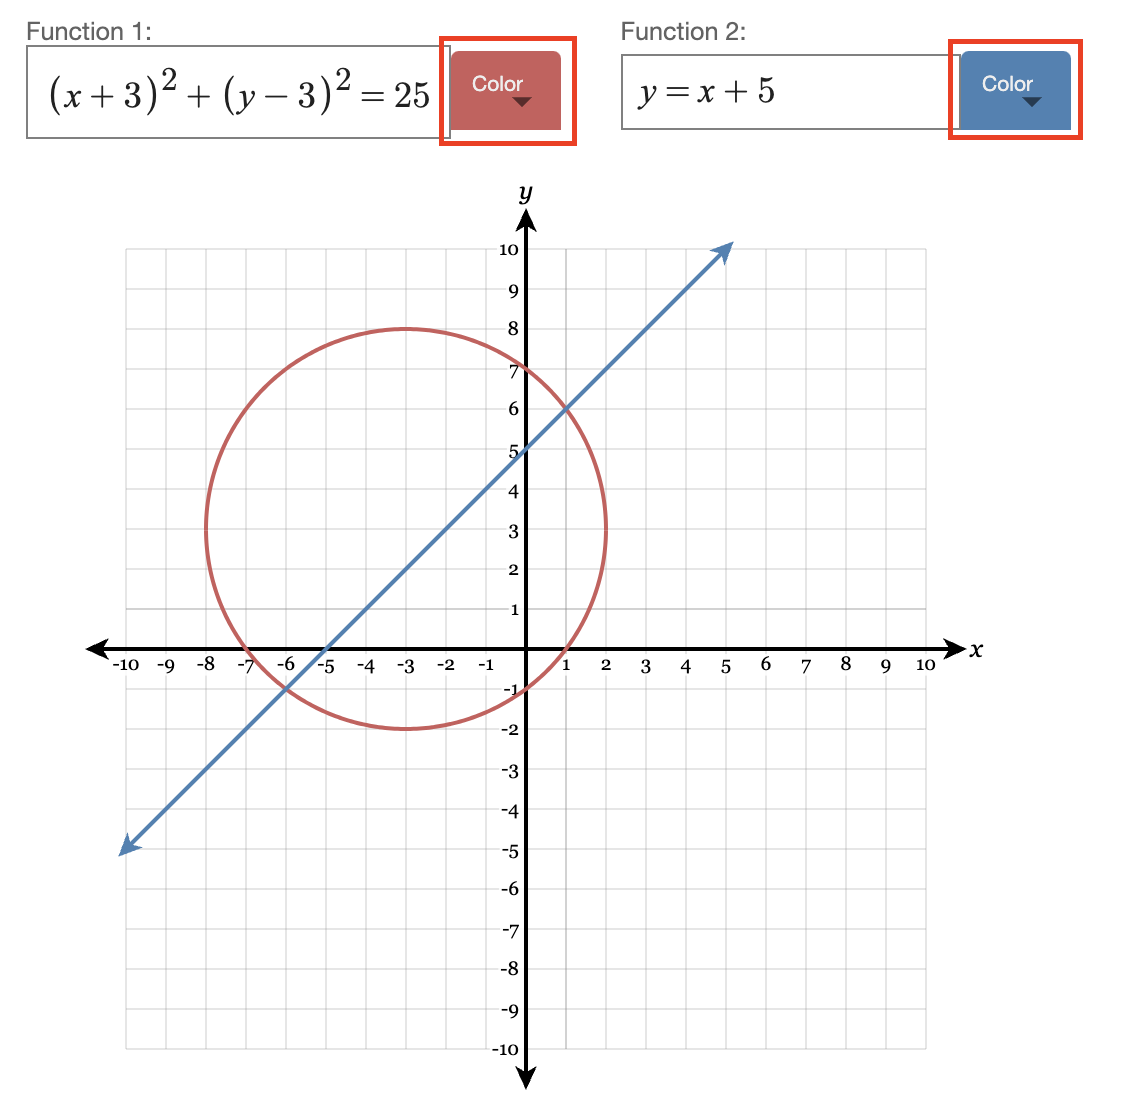 |
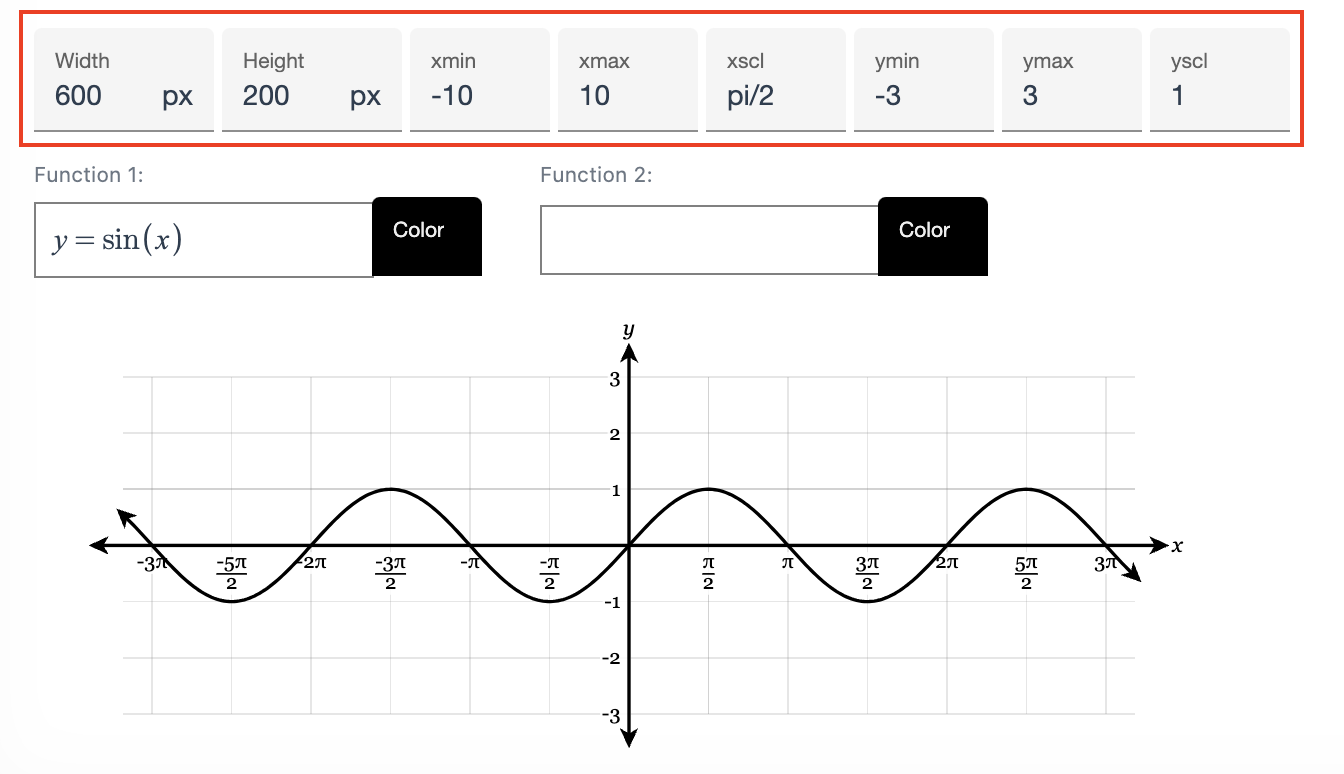
The graph creator only graphs in radian mode. However, if you would like to graph in degrees, you can substitute x with 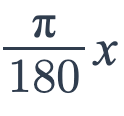 . . |
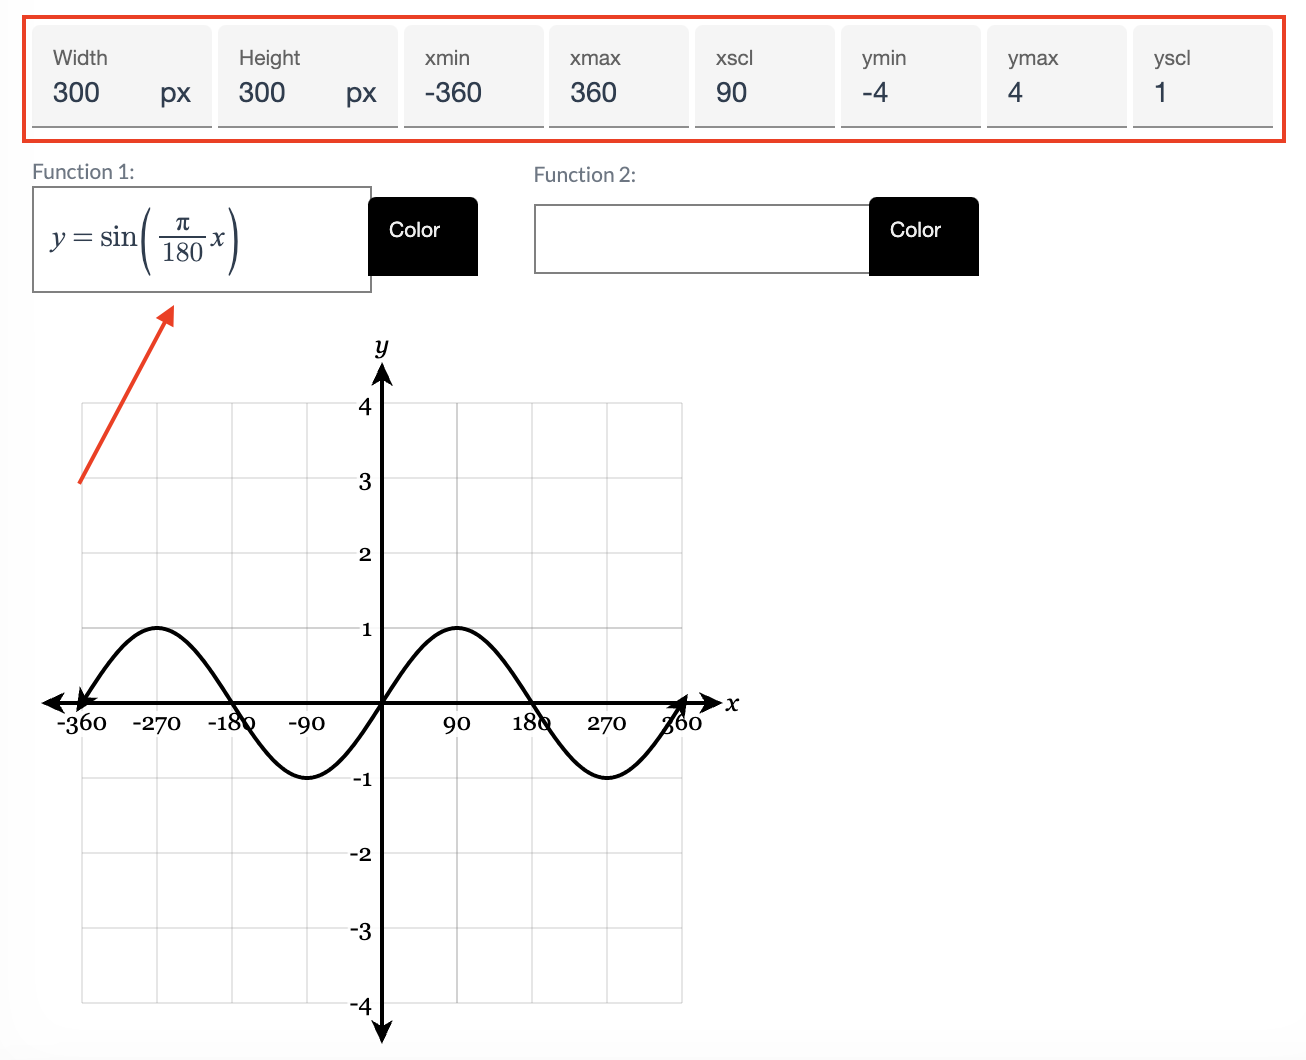 |
Custom Graph Settings
| There are several adjustments you can make to your custom graph. The width and height settings allow you to resize your graph. | 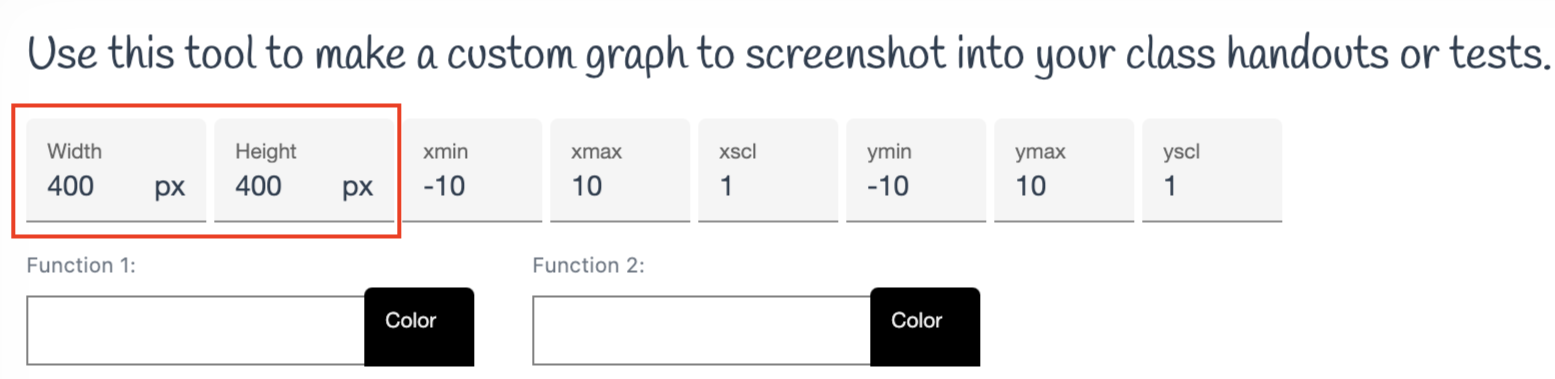 |
| The min and max settings determine the minimum and maximum values for the x- and y-axes, respectively. | 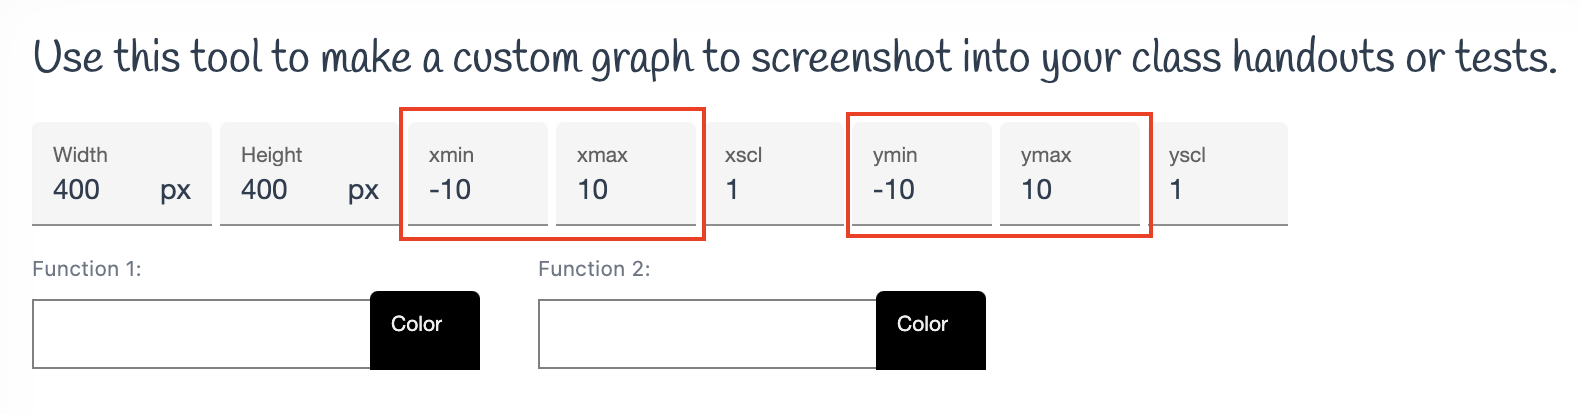 |
| The xscl and yscl settings allow you to adjust the scale of your x- and y-axes. | 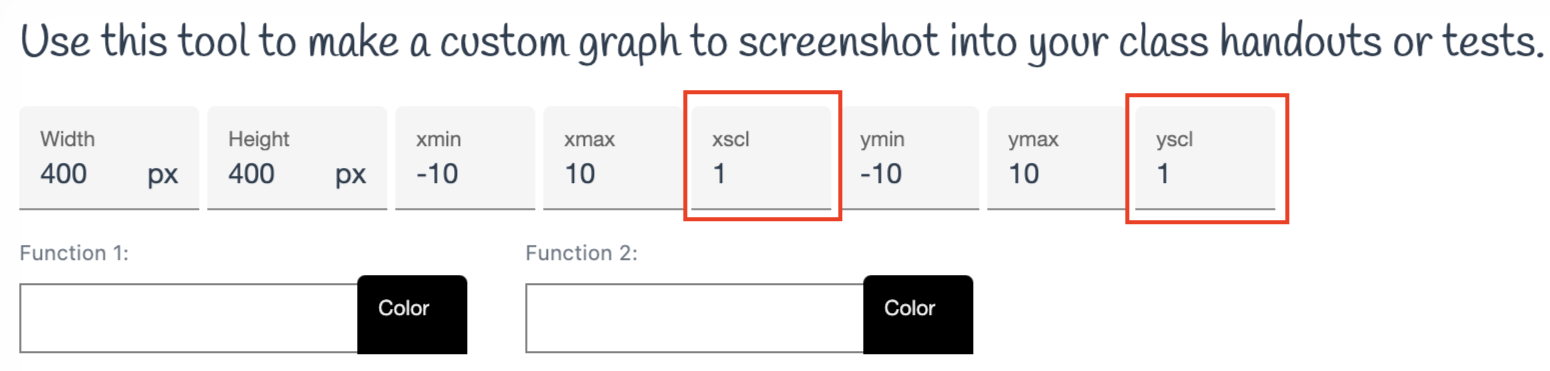 |
| Note: You can only graph up to two equations at a time and are unable to graph inequalities. |
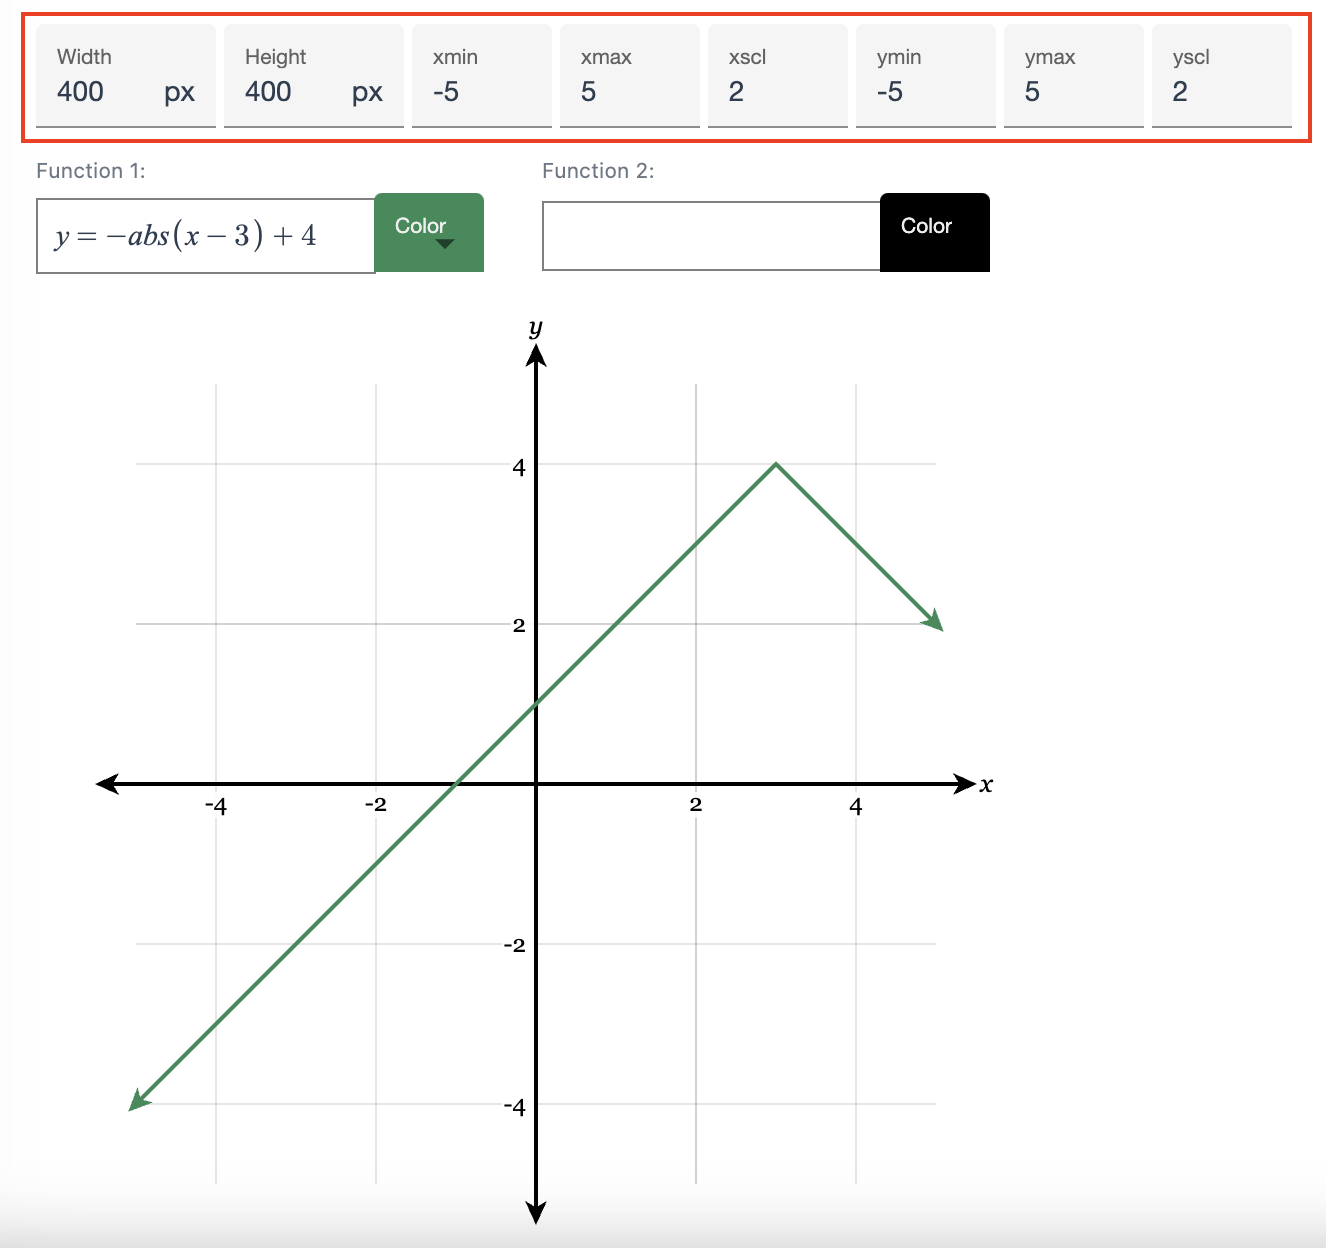
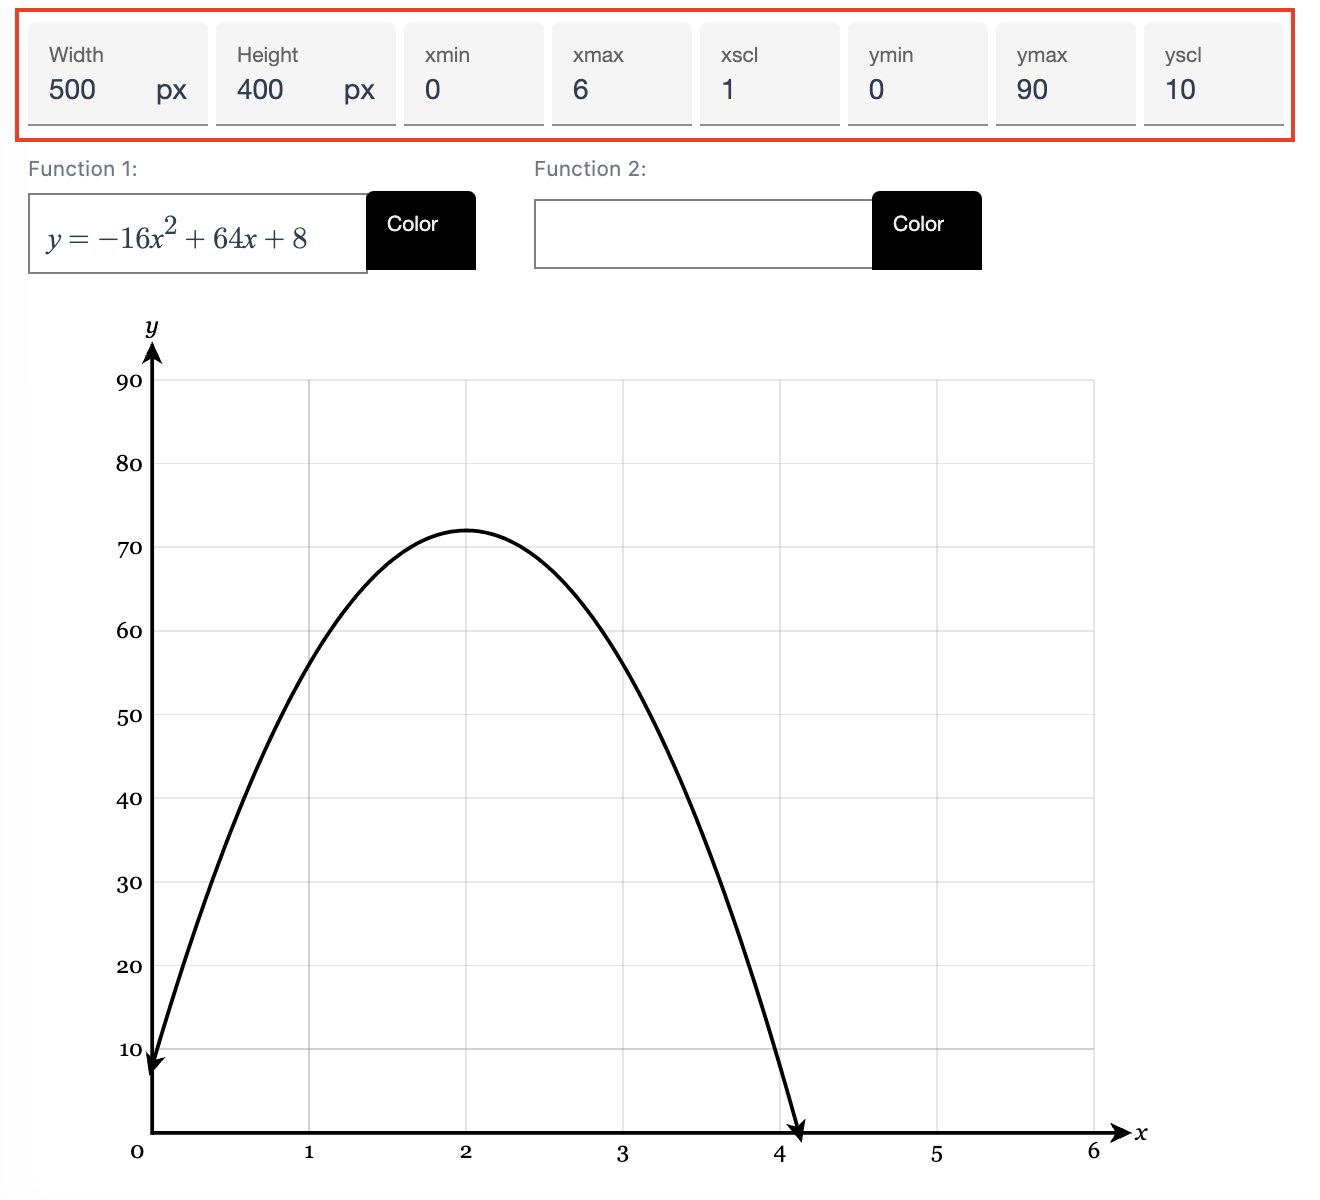
Graph Examples
Here are some example settings you can select to create different graphs.
 |
 |
 |
 |
- custom graph
- graph creator
- graph maker
Was this article helpful?