Table of Contents
Add a Mathematical Expression or Equation
| To insert a mathematical expression or equation into a teacher-created question, you can use our 'Math to Latex Converter.' LaTeX is a typesetting code or language commonly used for crafting mathematical expressions. | 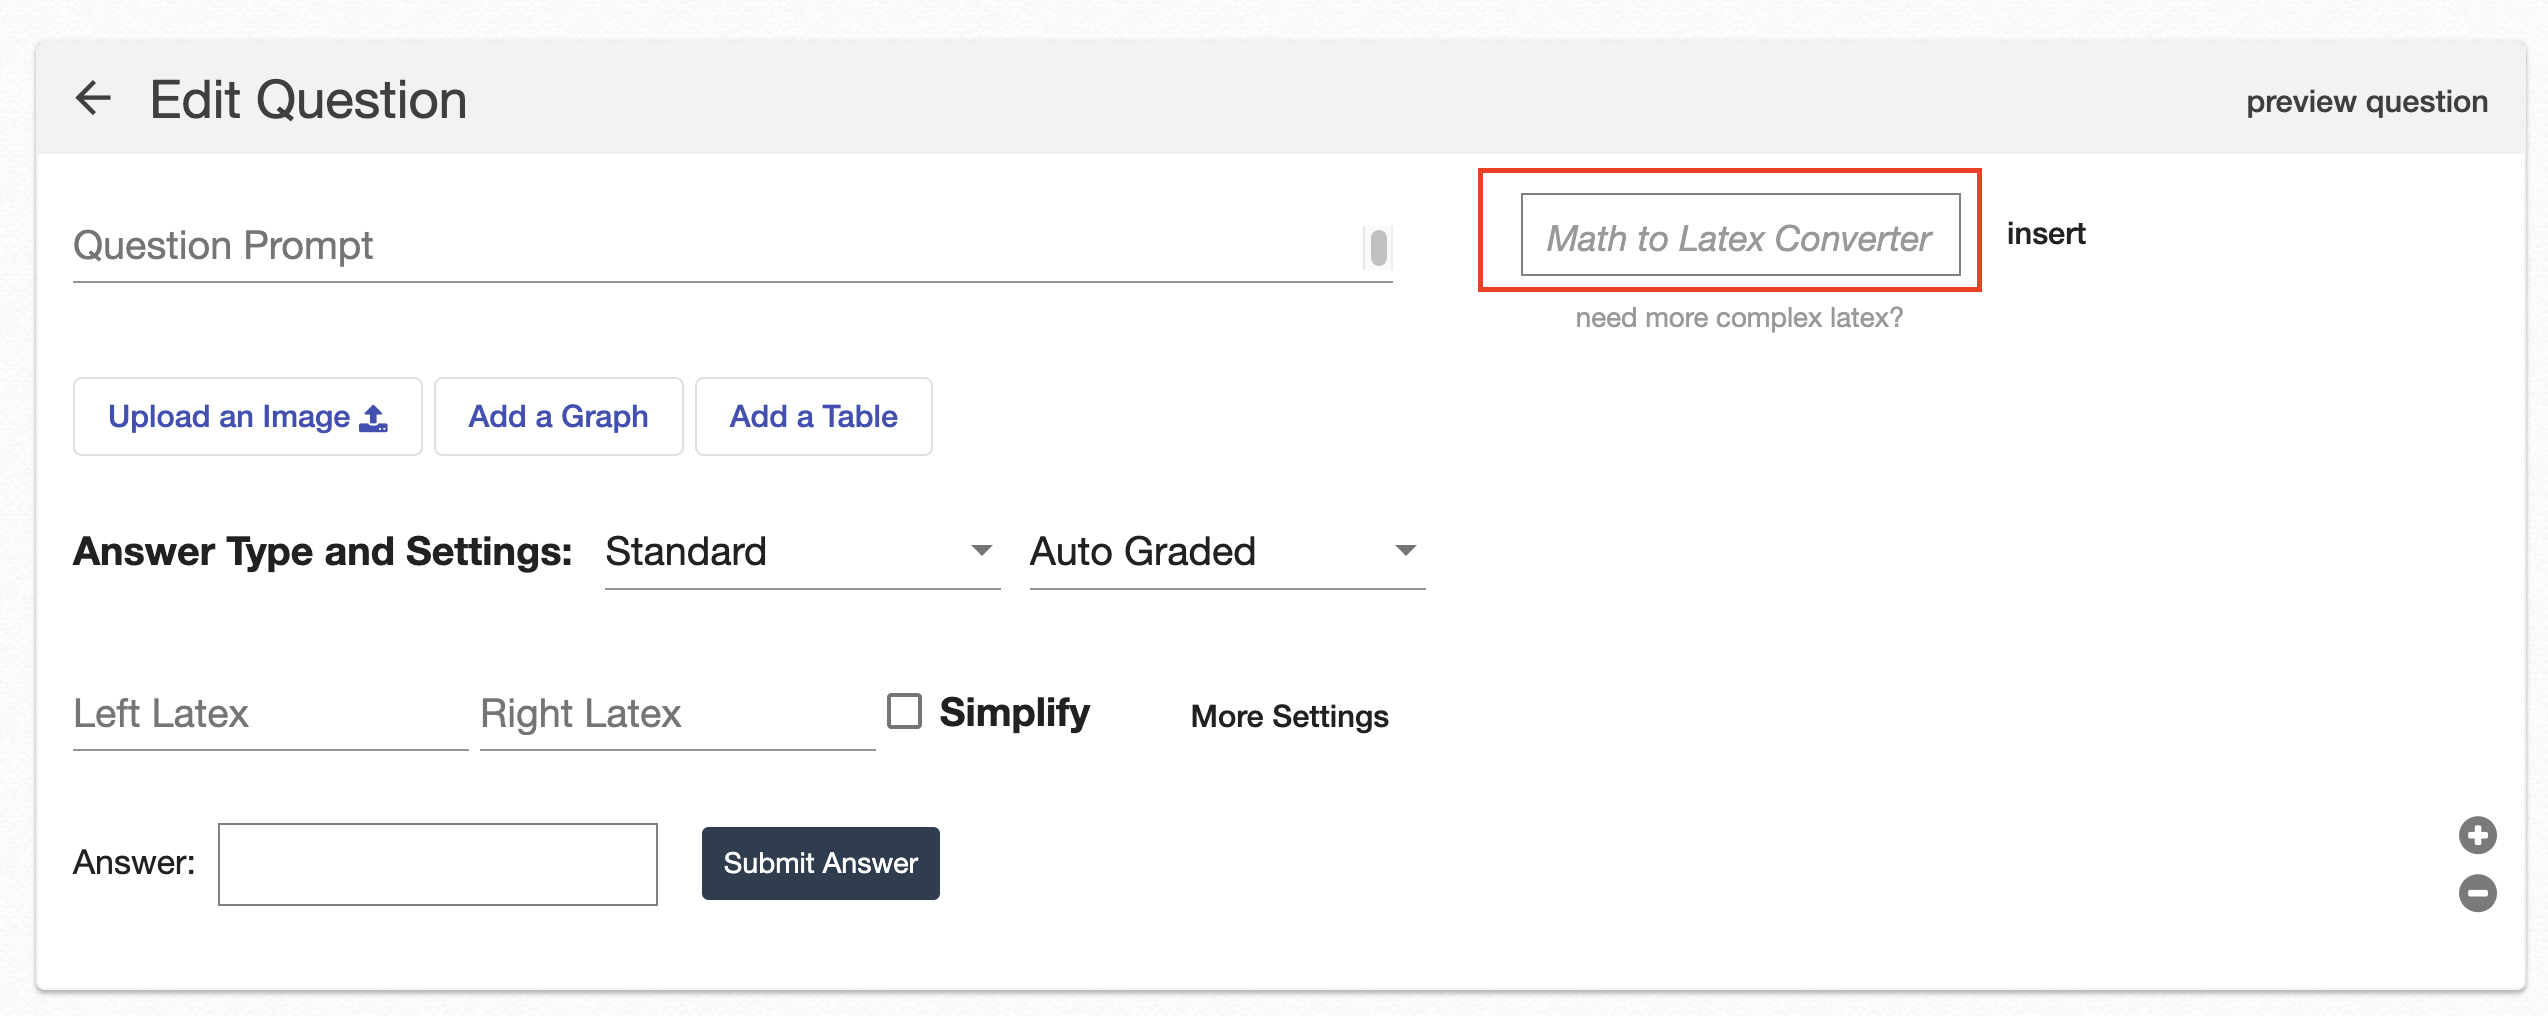 |
| Simply type the expression or equation you wish to include, then click “insert.” | 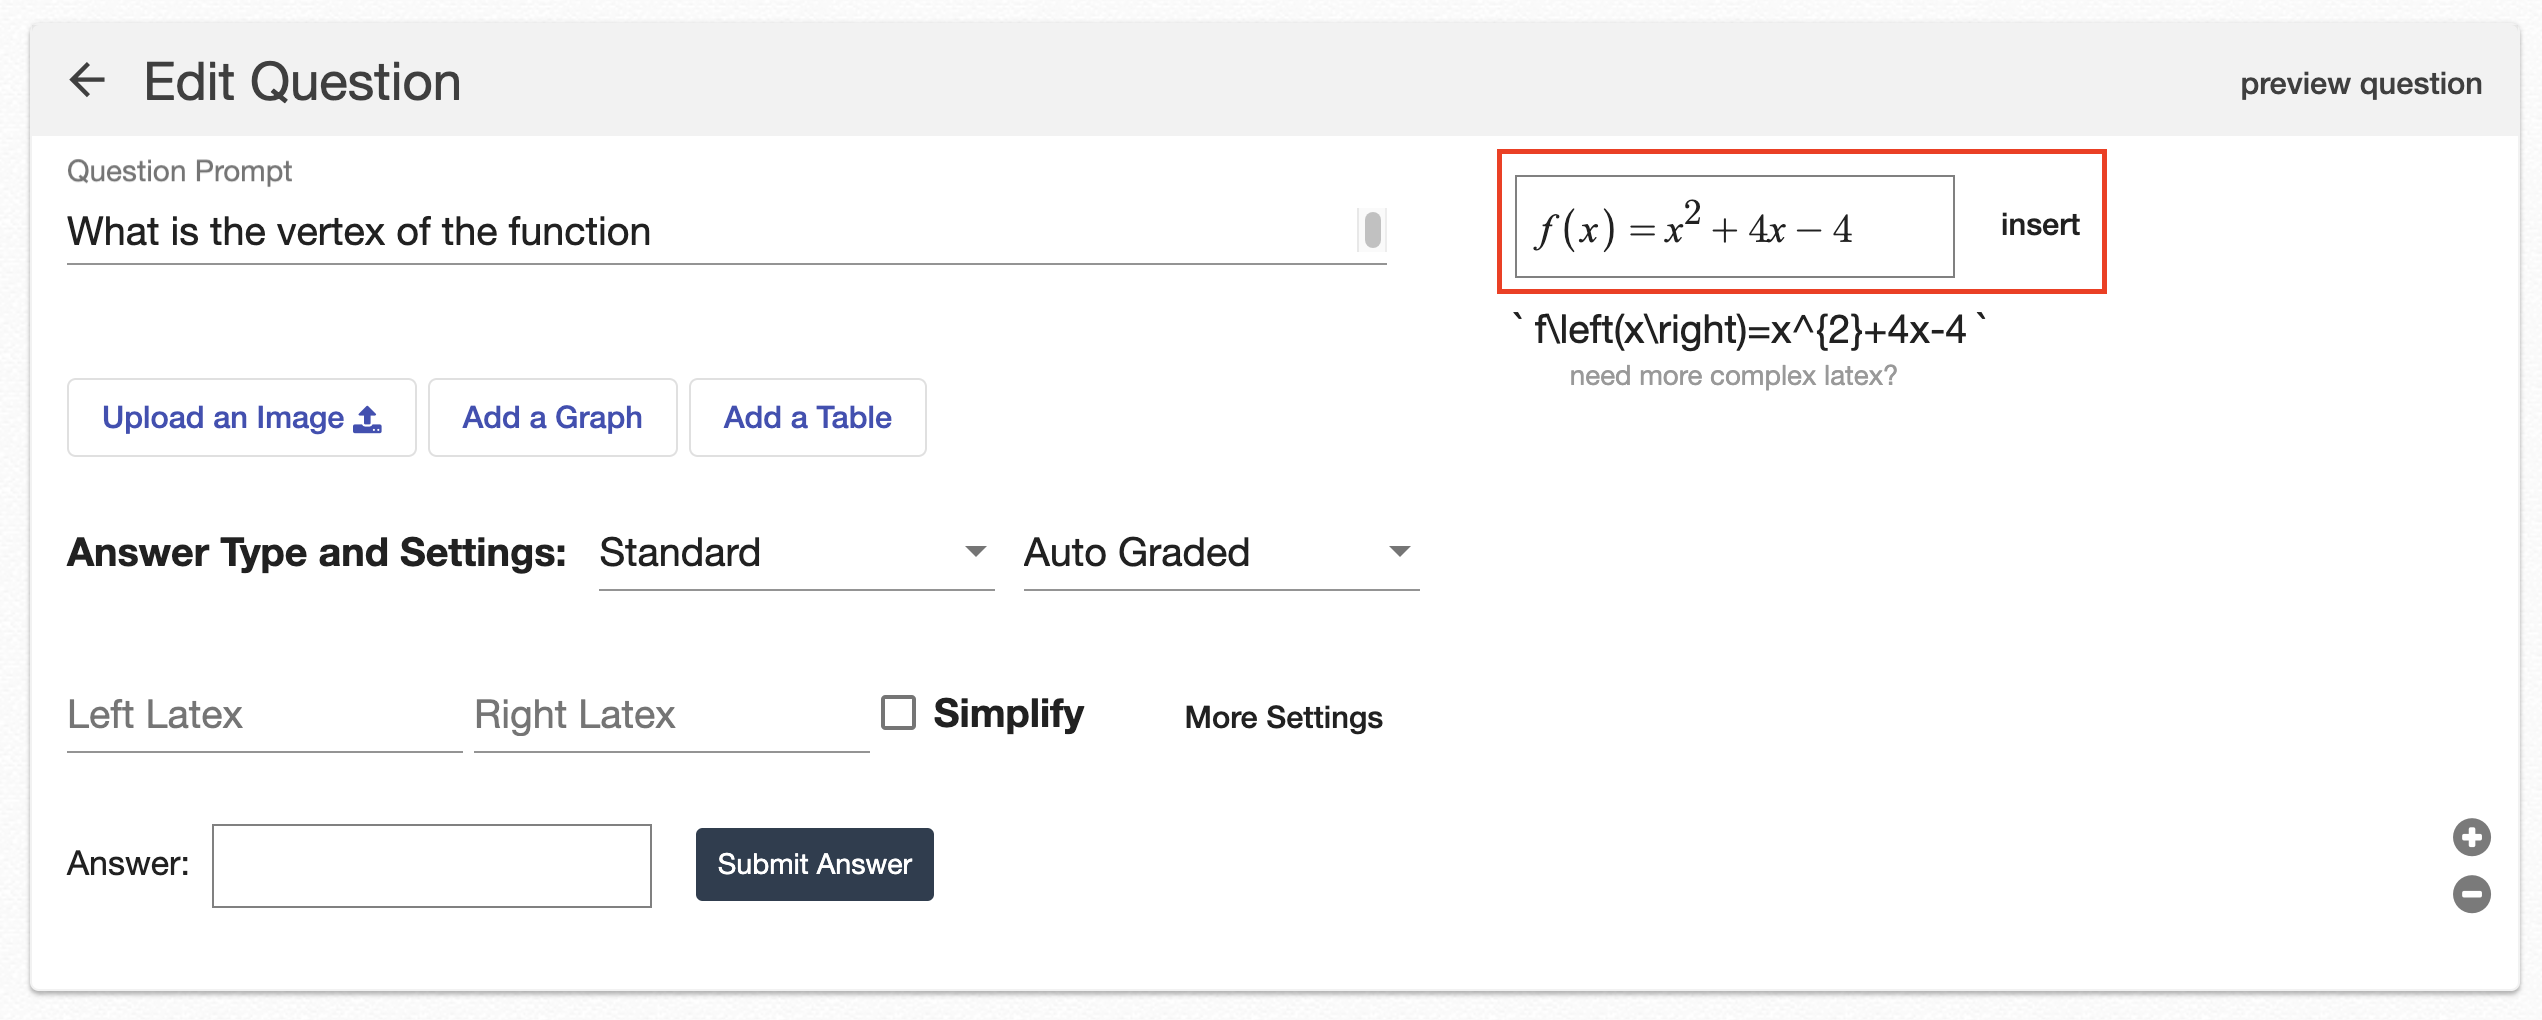 |
| This action will convert the expression or equation into LaTeX code and insert it into the question prompt. A preview of how the question would appear for students will also be displayed below. | 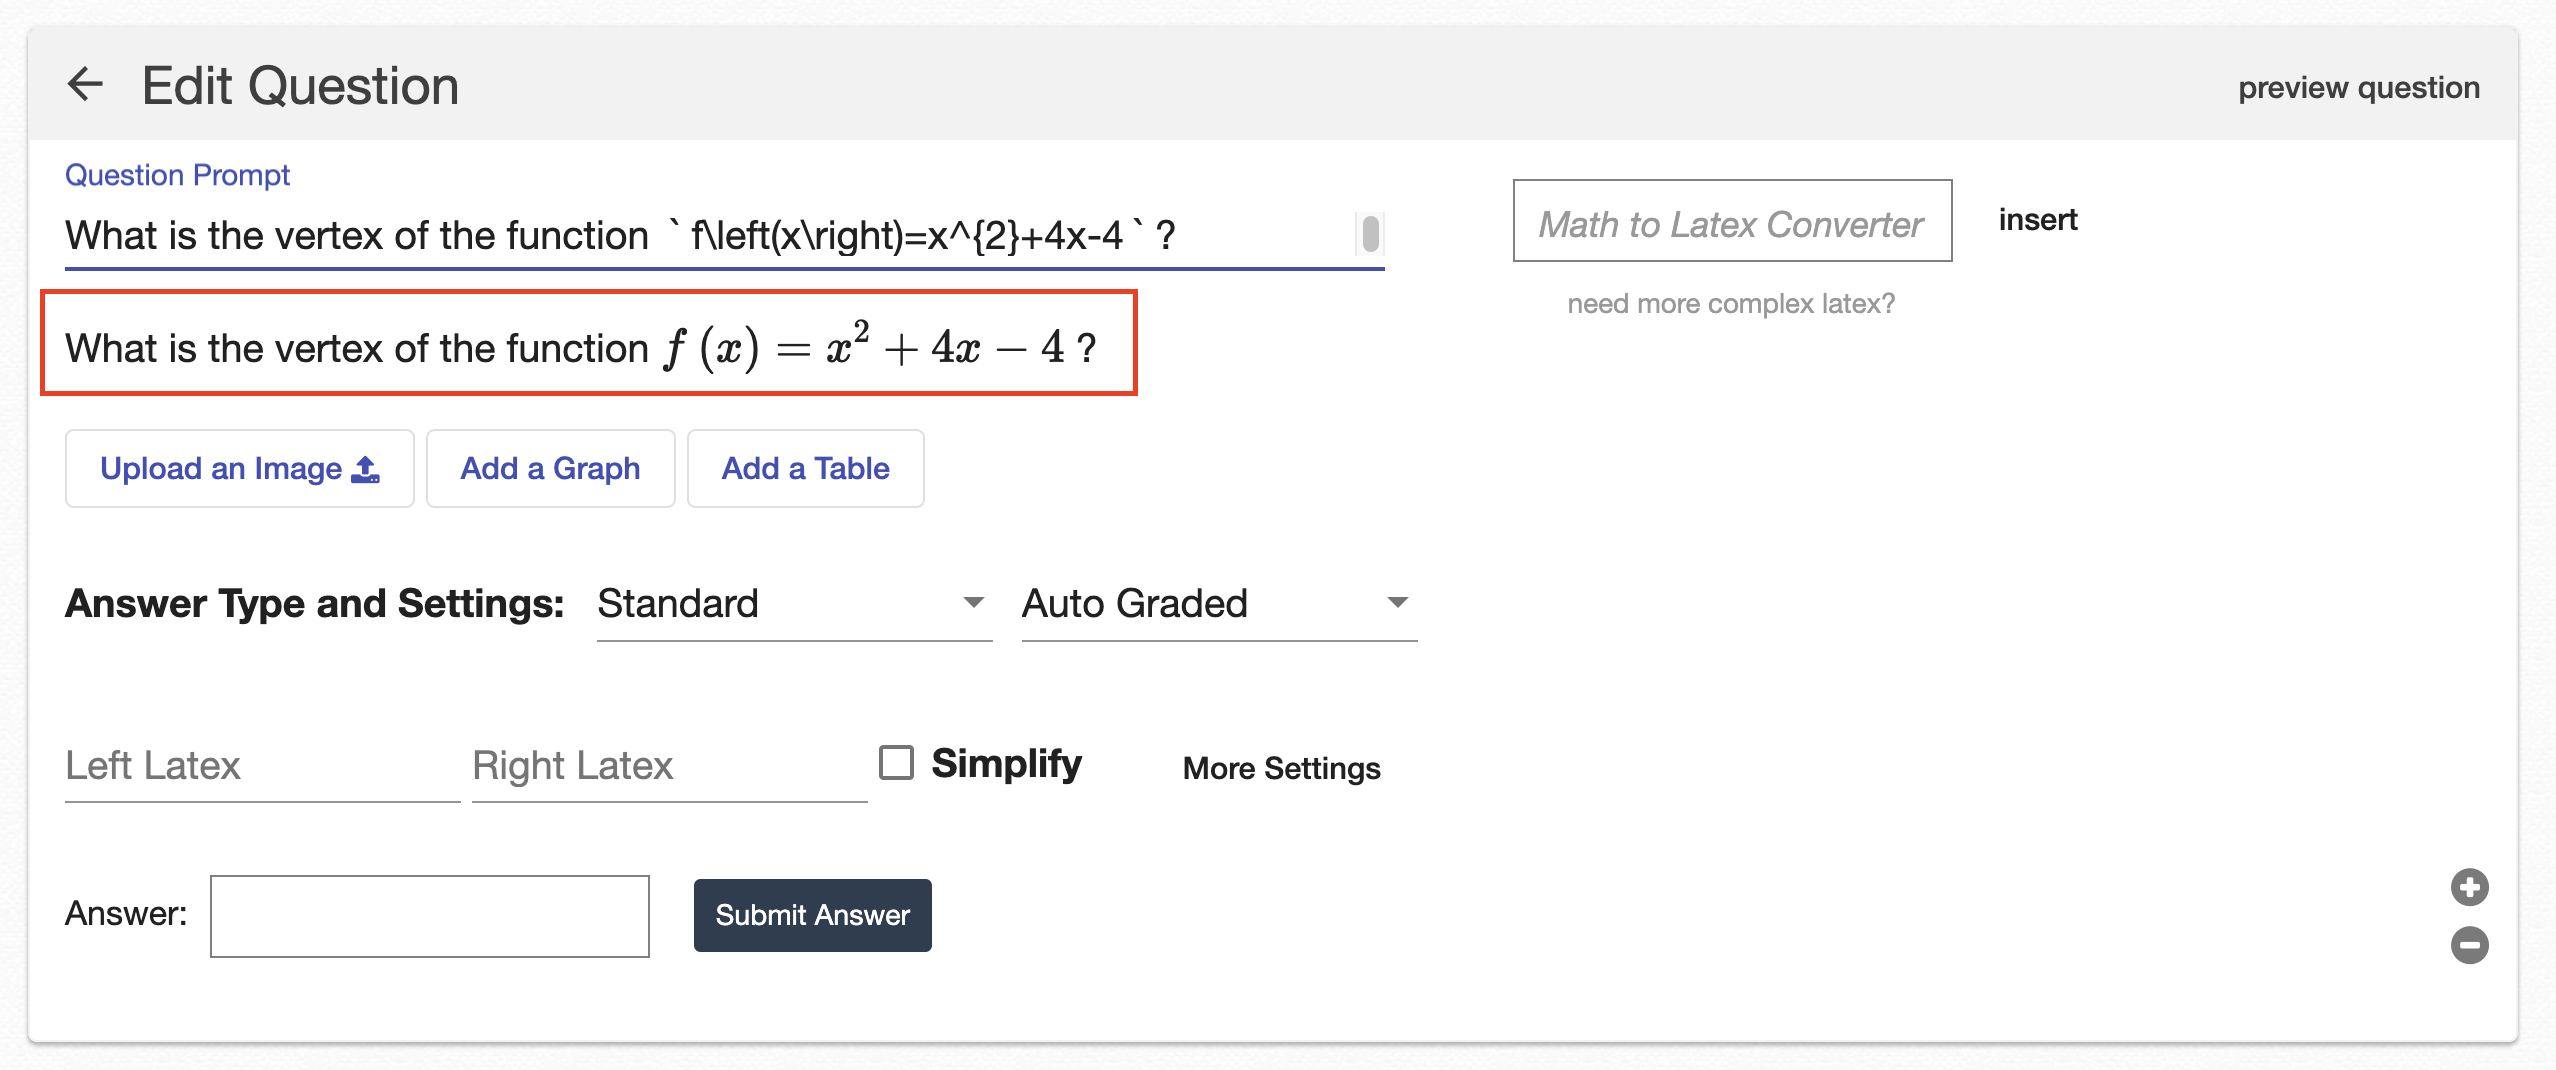 |
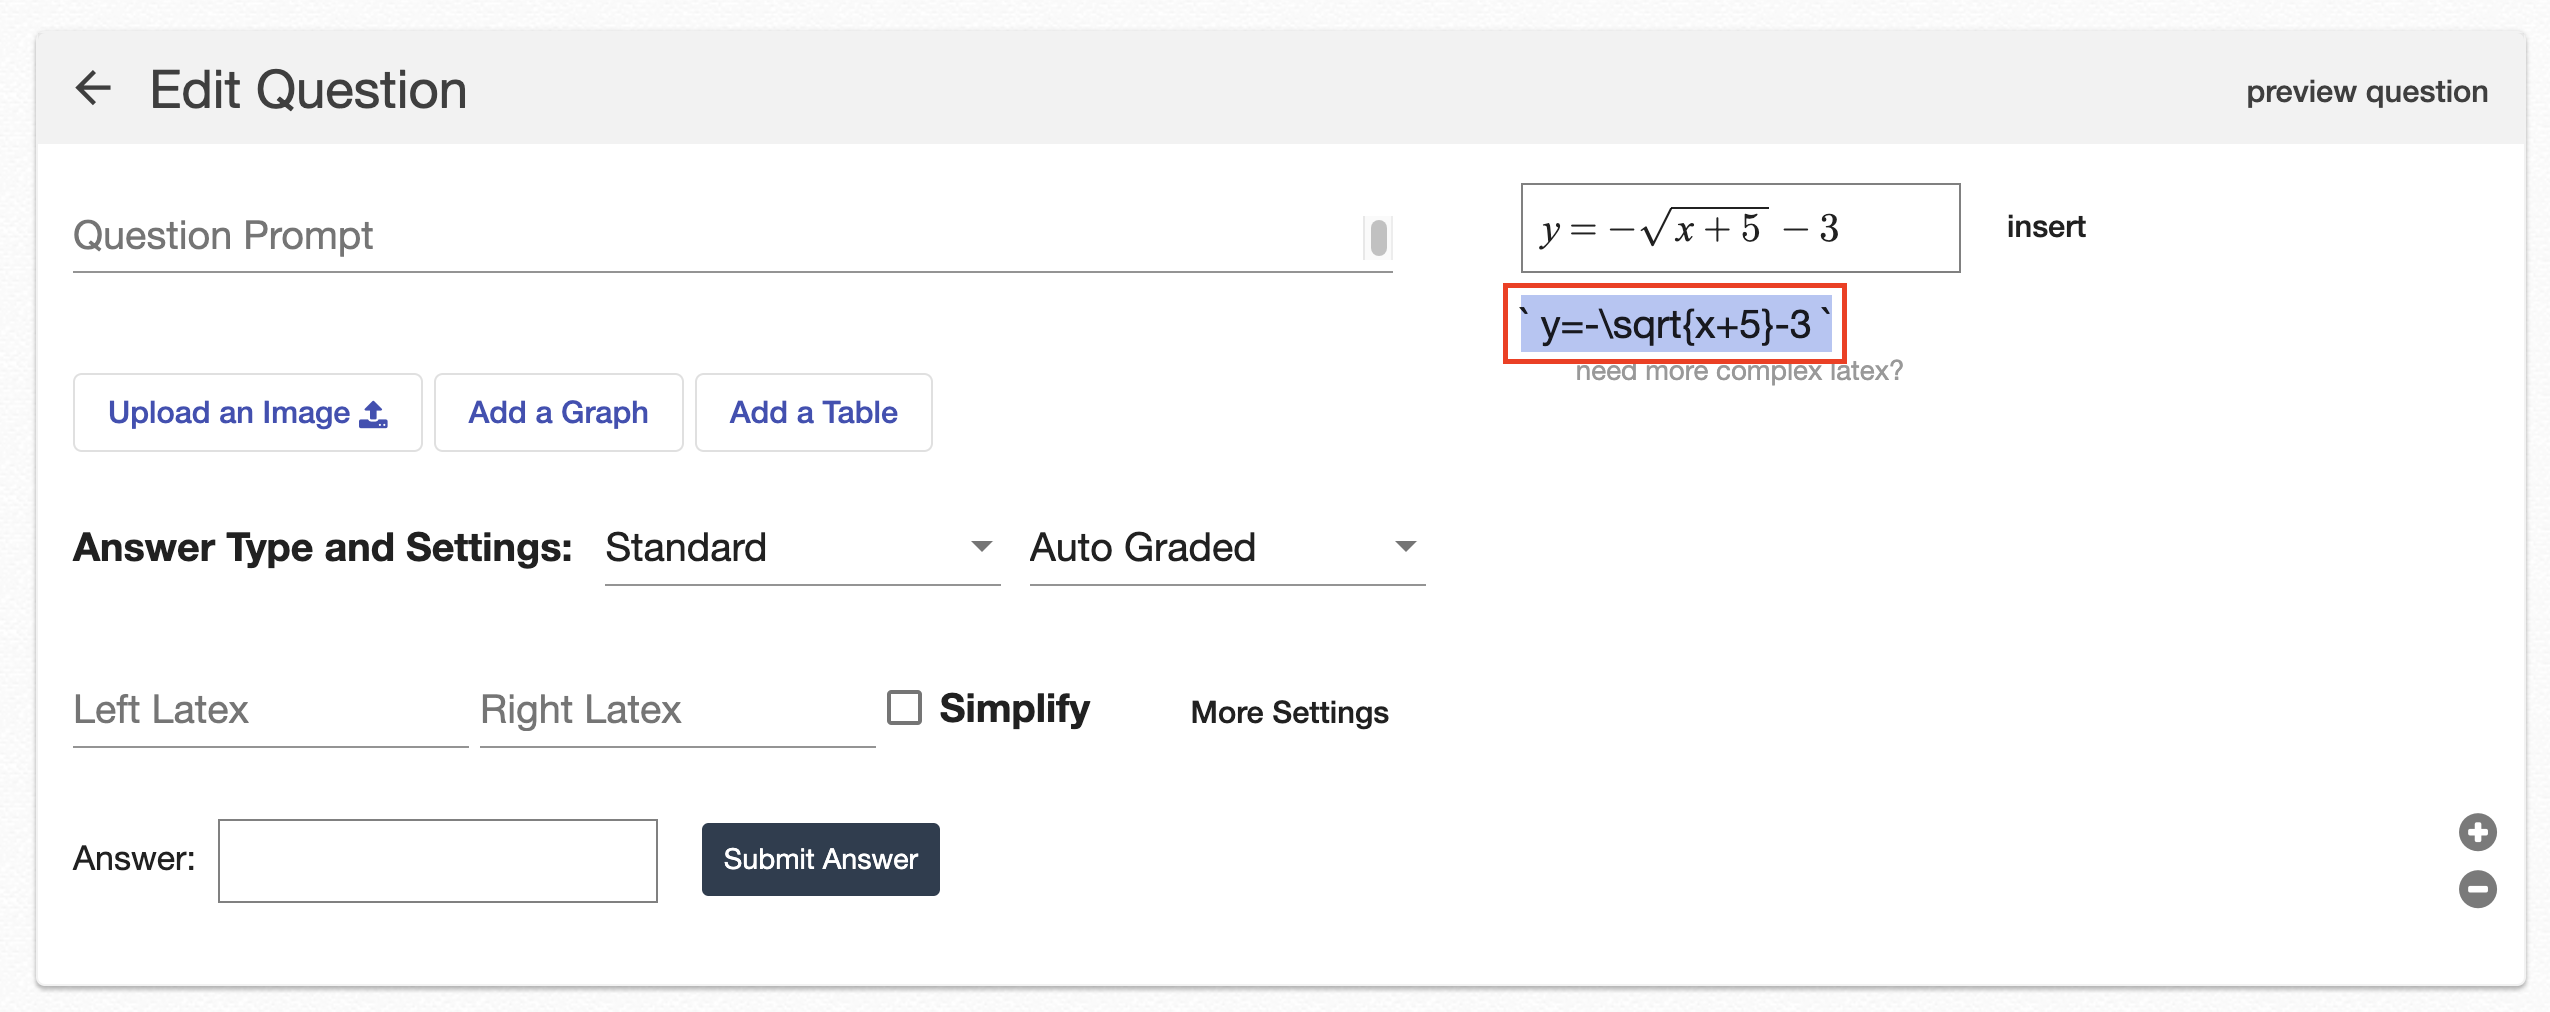
Additionally, you can copy the expression or equation by selecting and copying the LaTeX code provided below the input. From there, you can paste the LaTeX into the question prompt itself, a table, or within the text of a guided sentence. |
 |
| For creating more advanced mathematical expressions, please select the “need more complex latex?” option. This will allow you to use a separate LaTeX editor and/or access a list of supported functions for composing more complex expressions. | 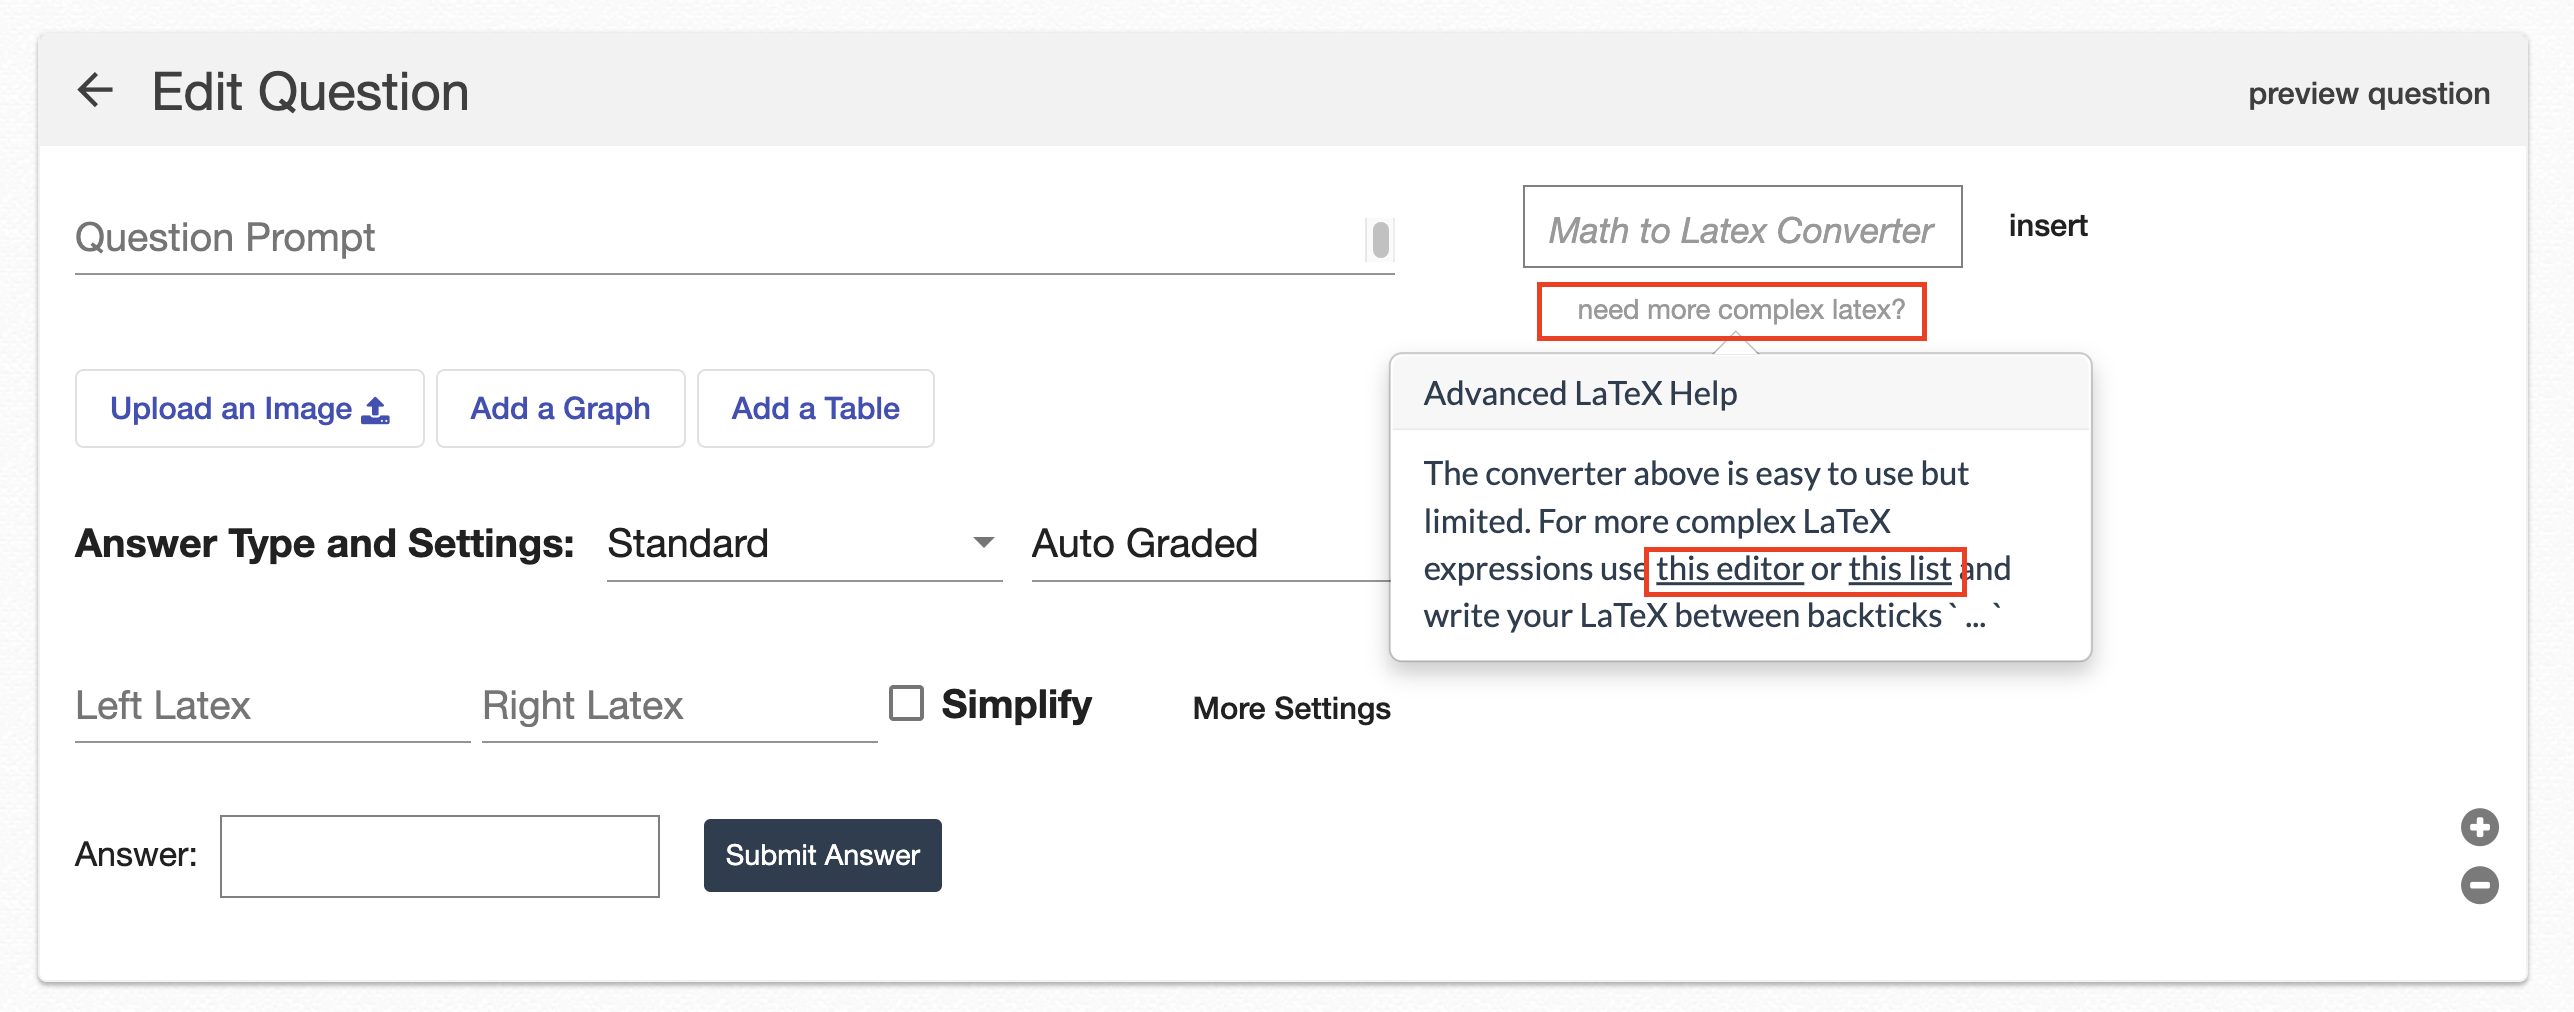 |
Add an Image
| You can upload an image to your question by clicking “Upload an Image." | 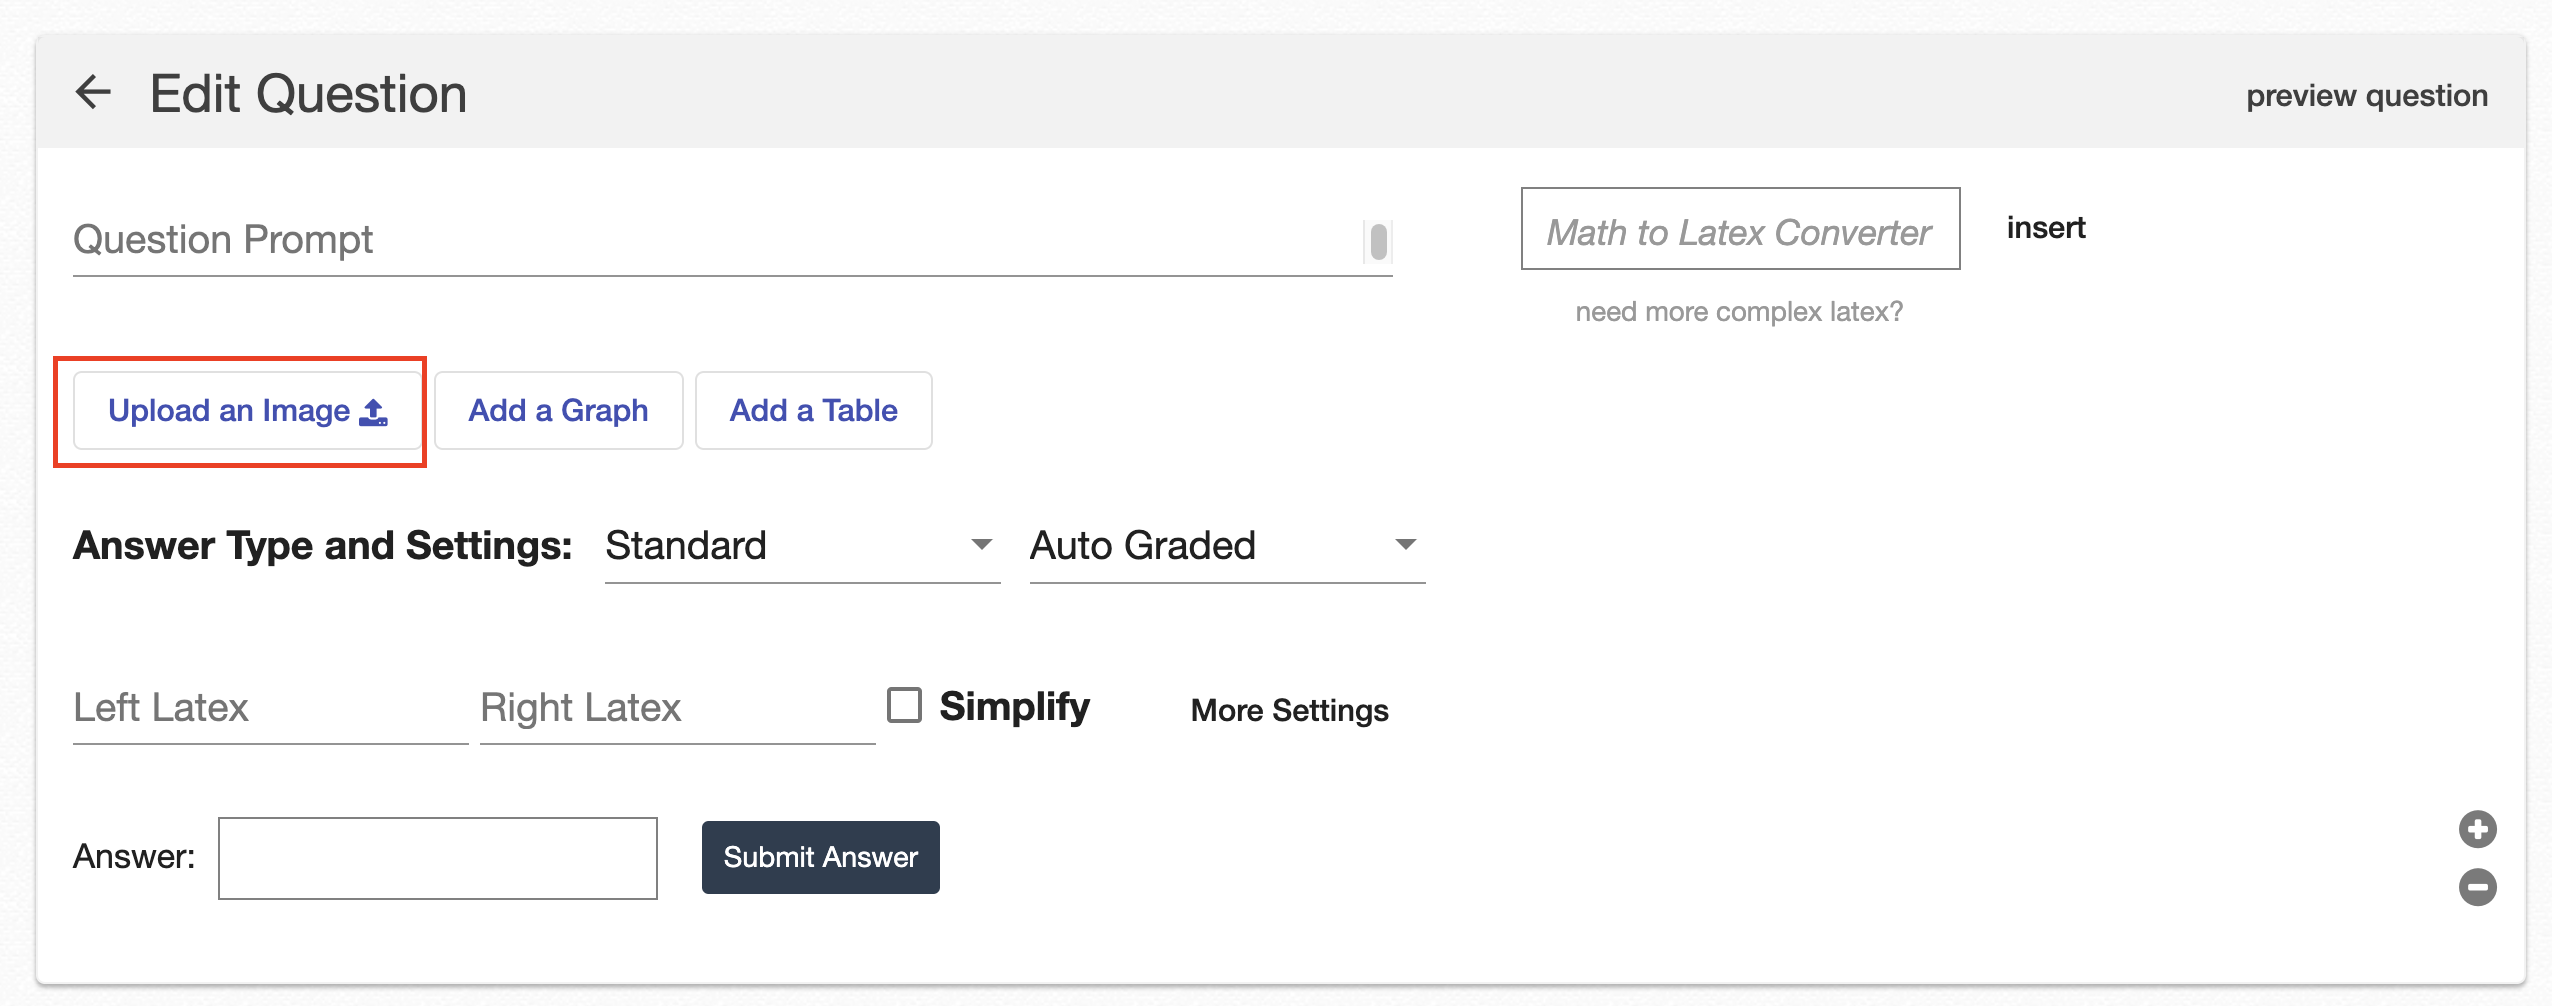 |
| Select the image you would like to upload. You can only upload .jpeg, .jpg, .png, and .gif images. | 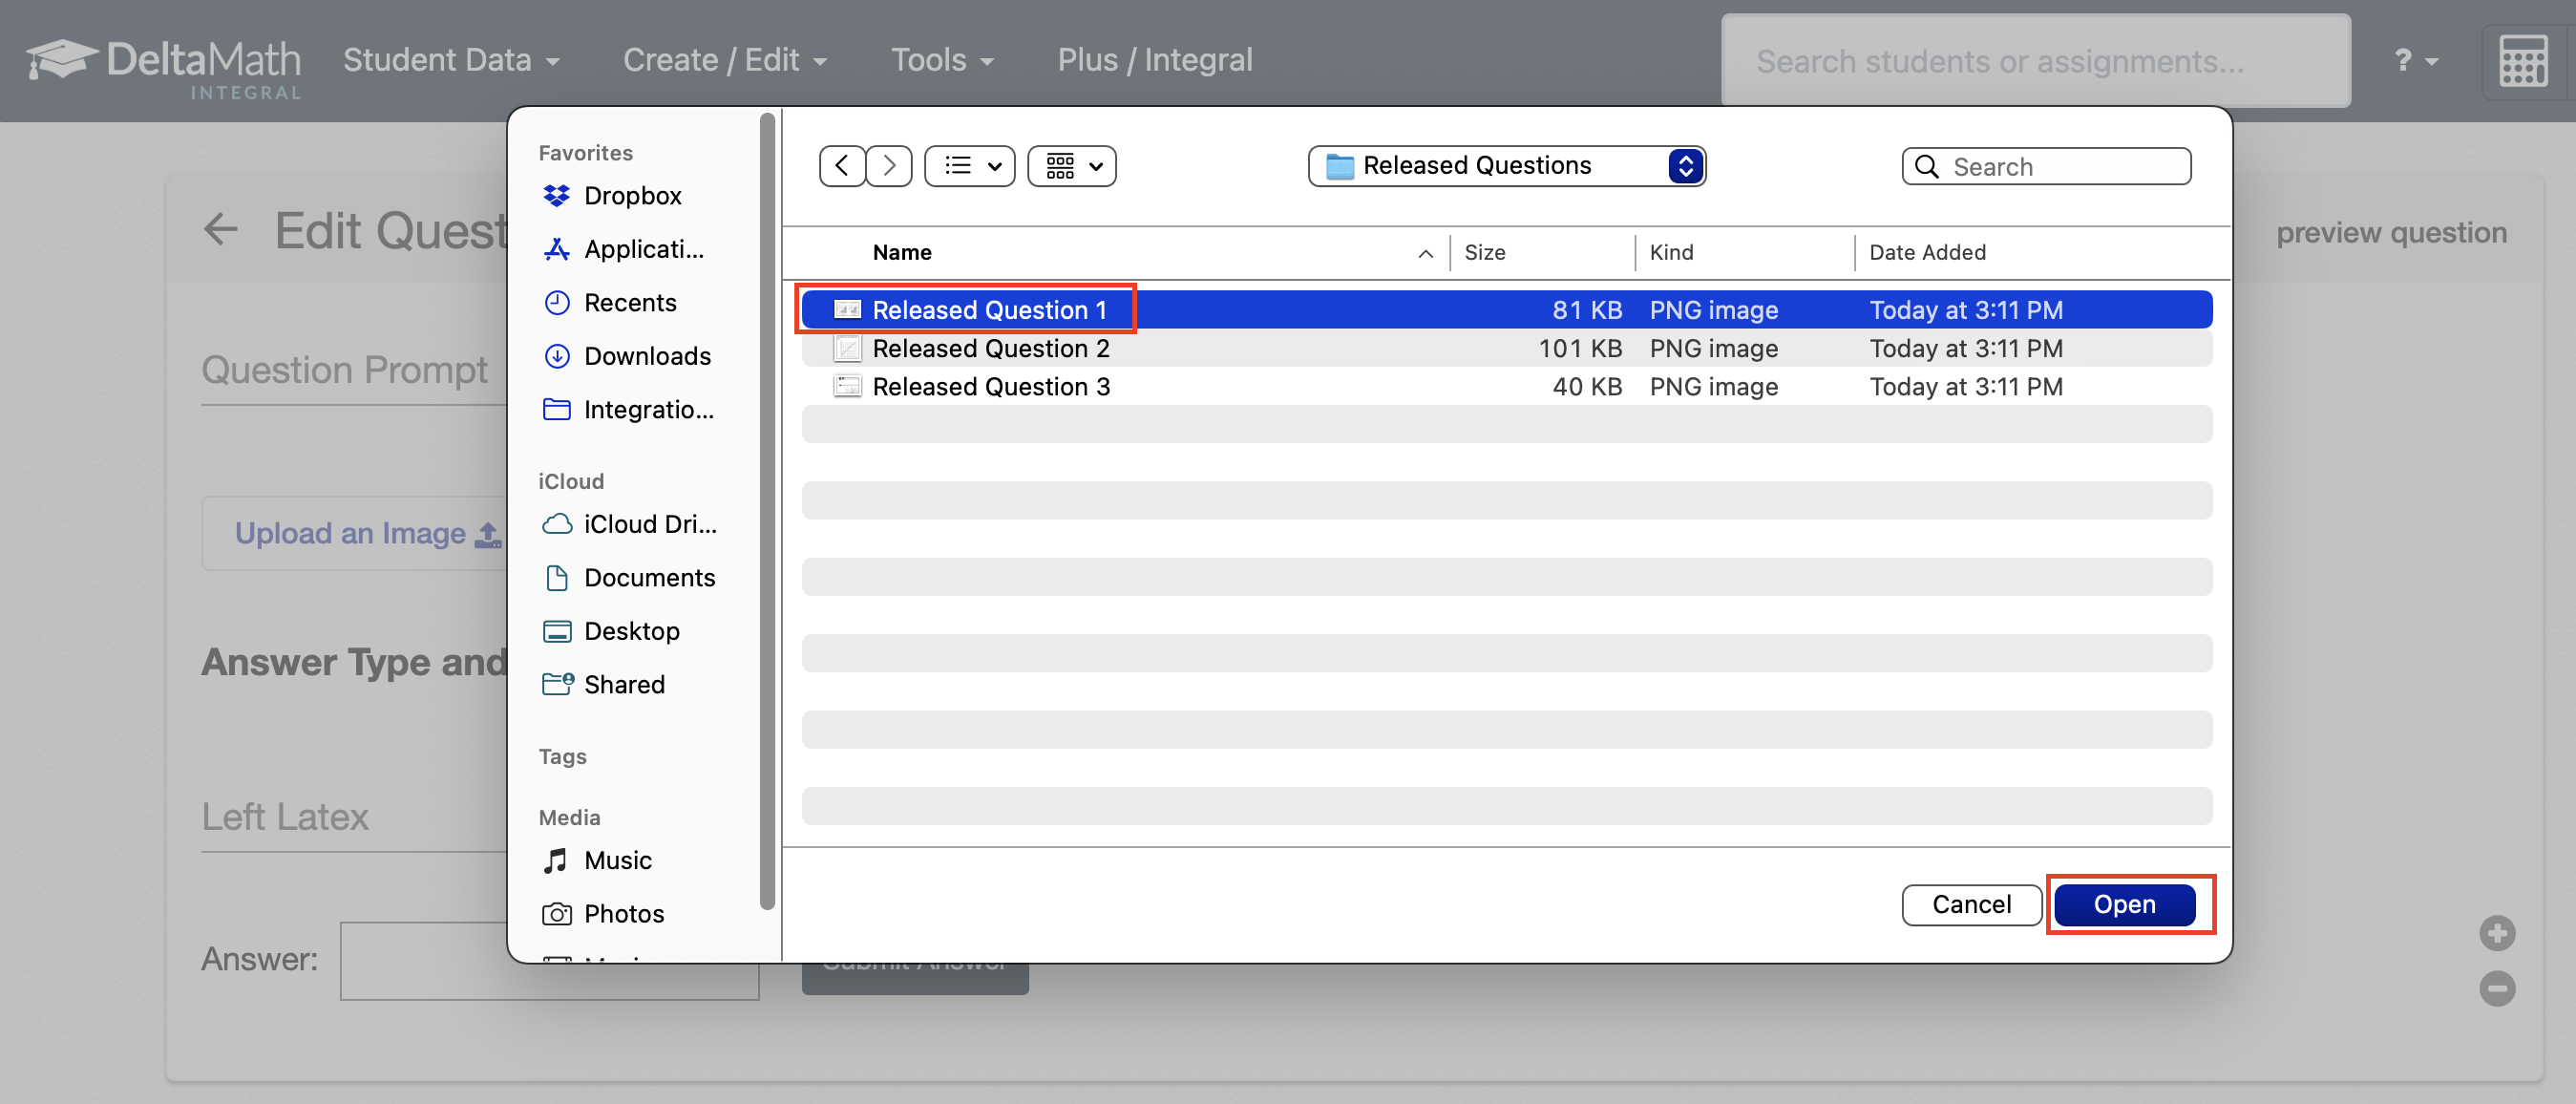 |
| To change or remove the image, click “Remove Image.” | 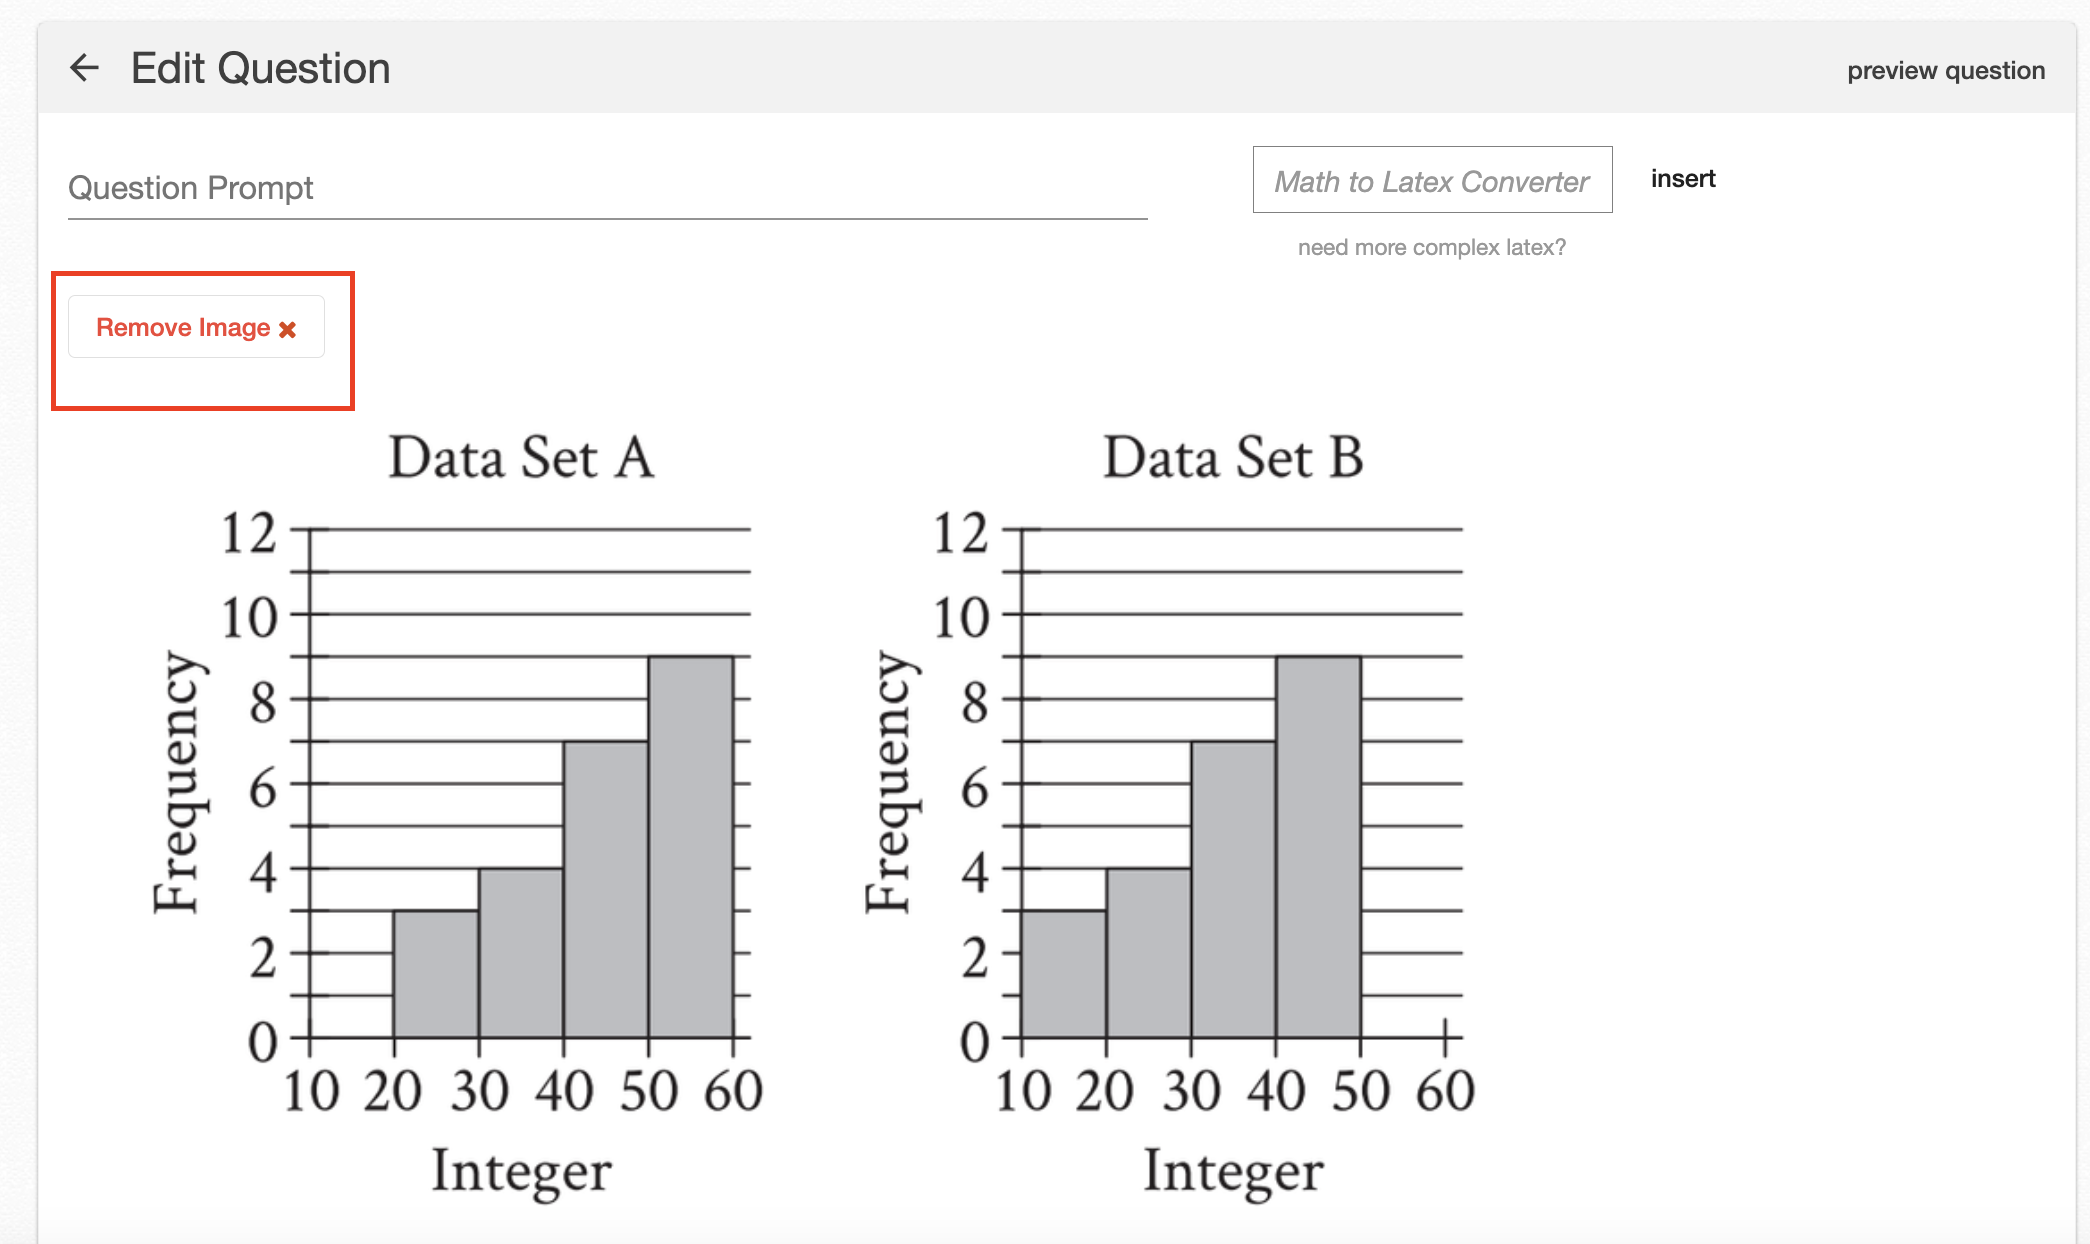 |
| Note: You can only upload one image per teacher-created question, and you cannot resize the image. |
Add a Graph
| To add a graph to your question, click “Add a Graph.” | 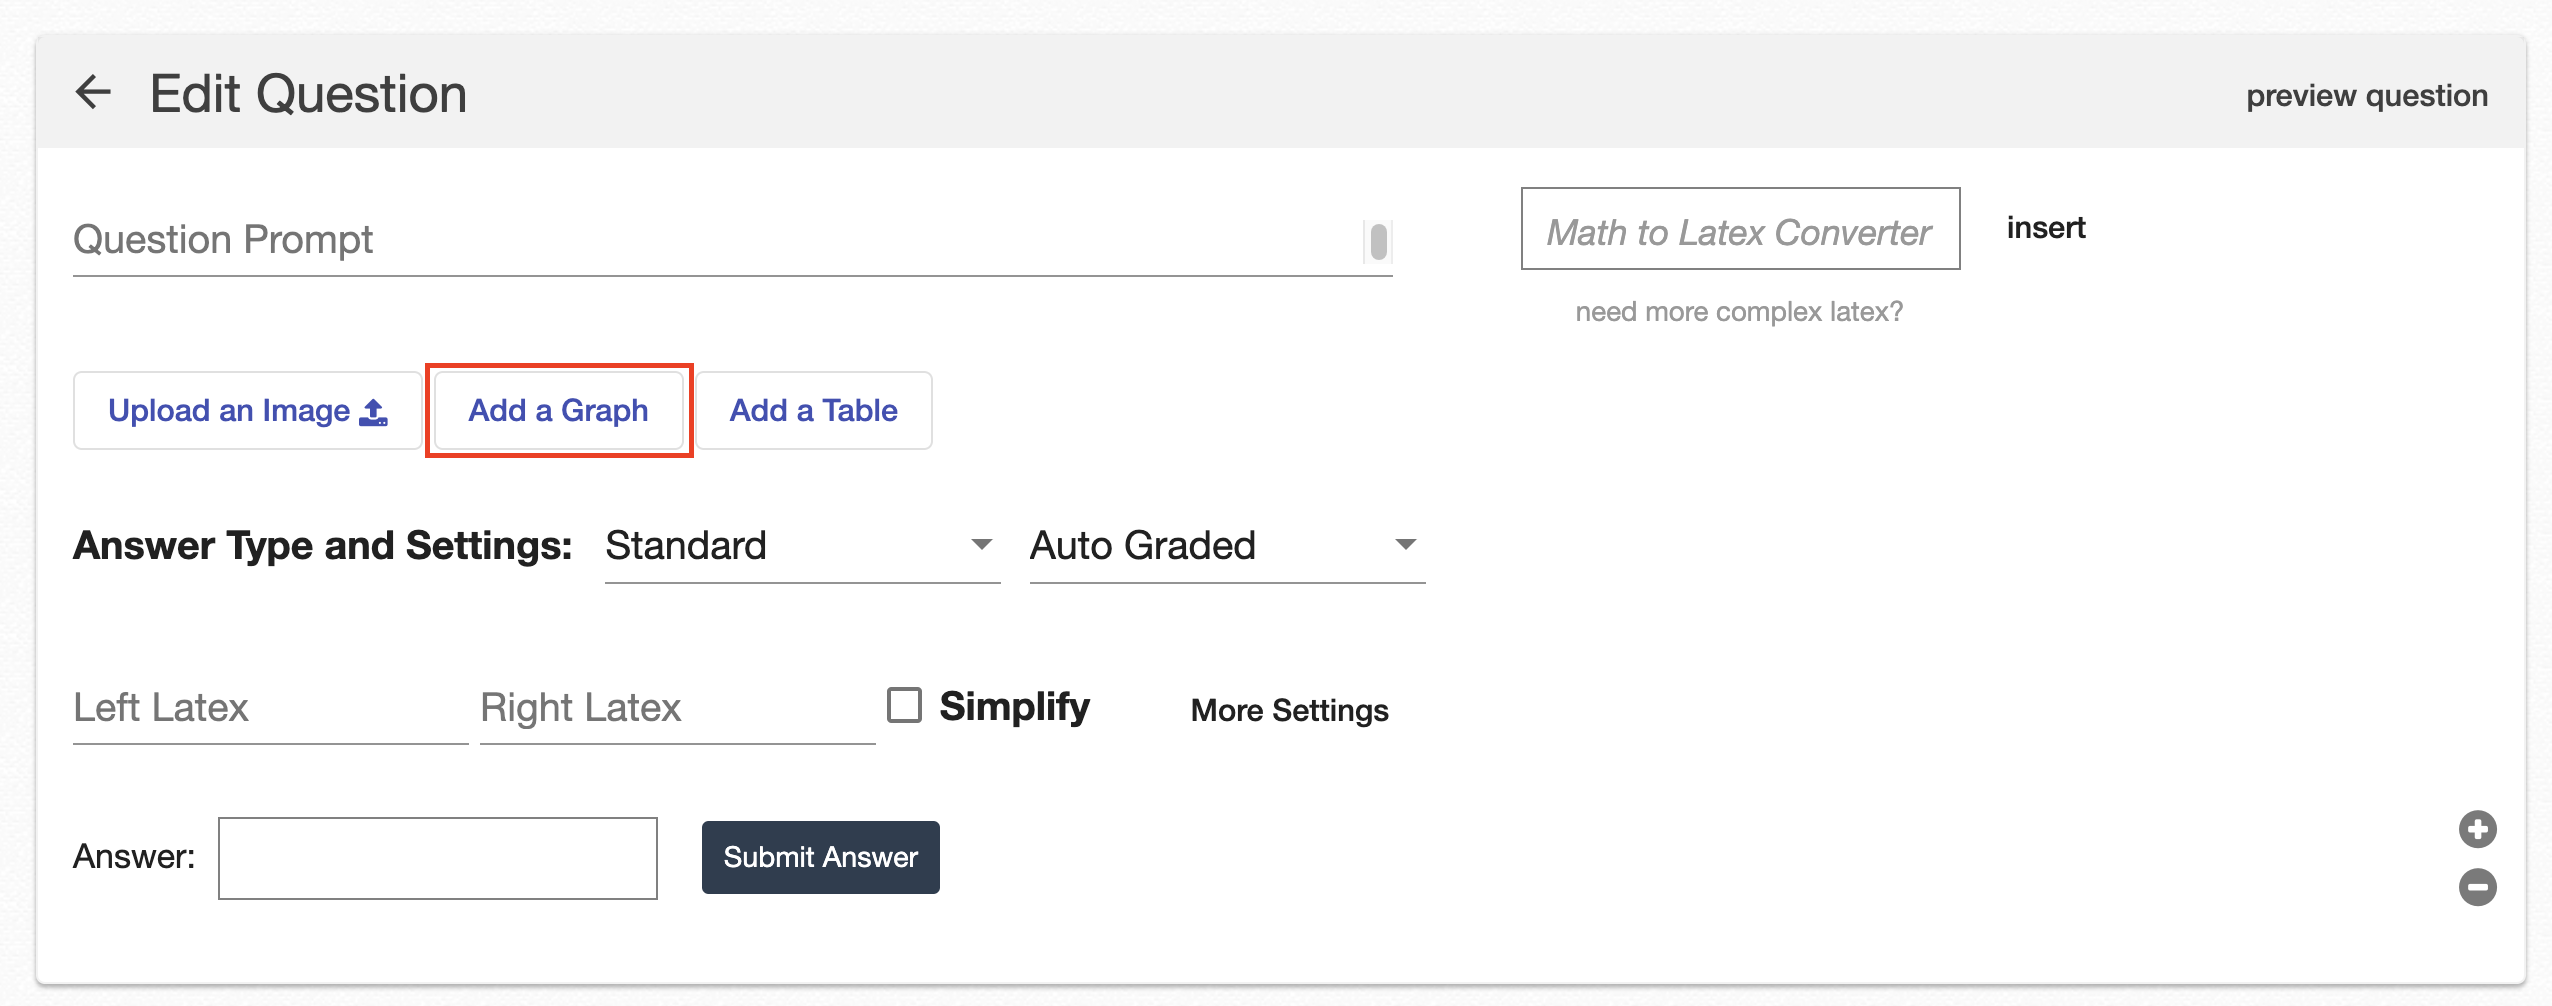 |
|
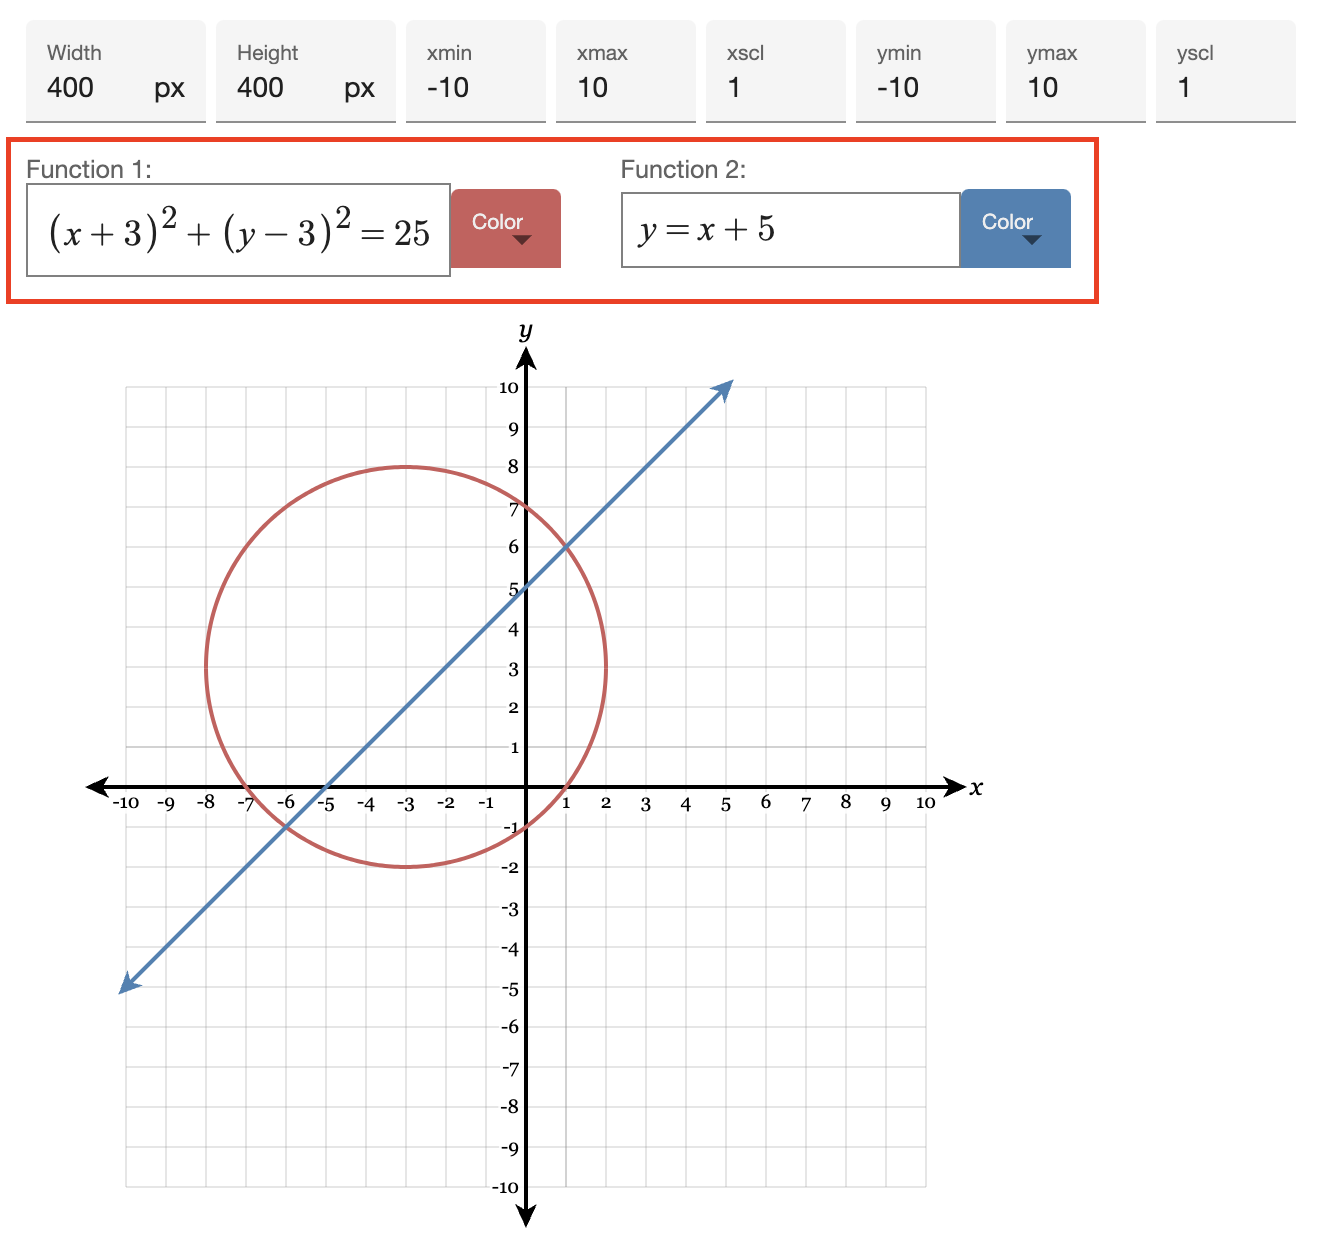
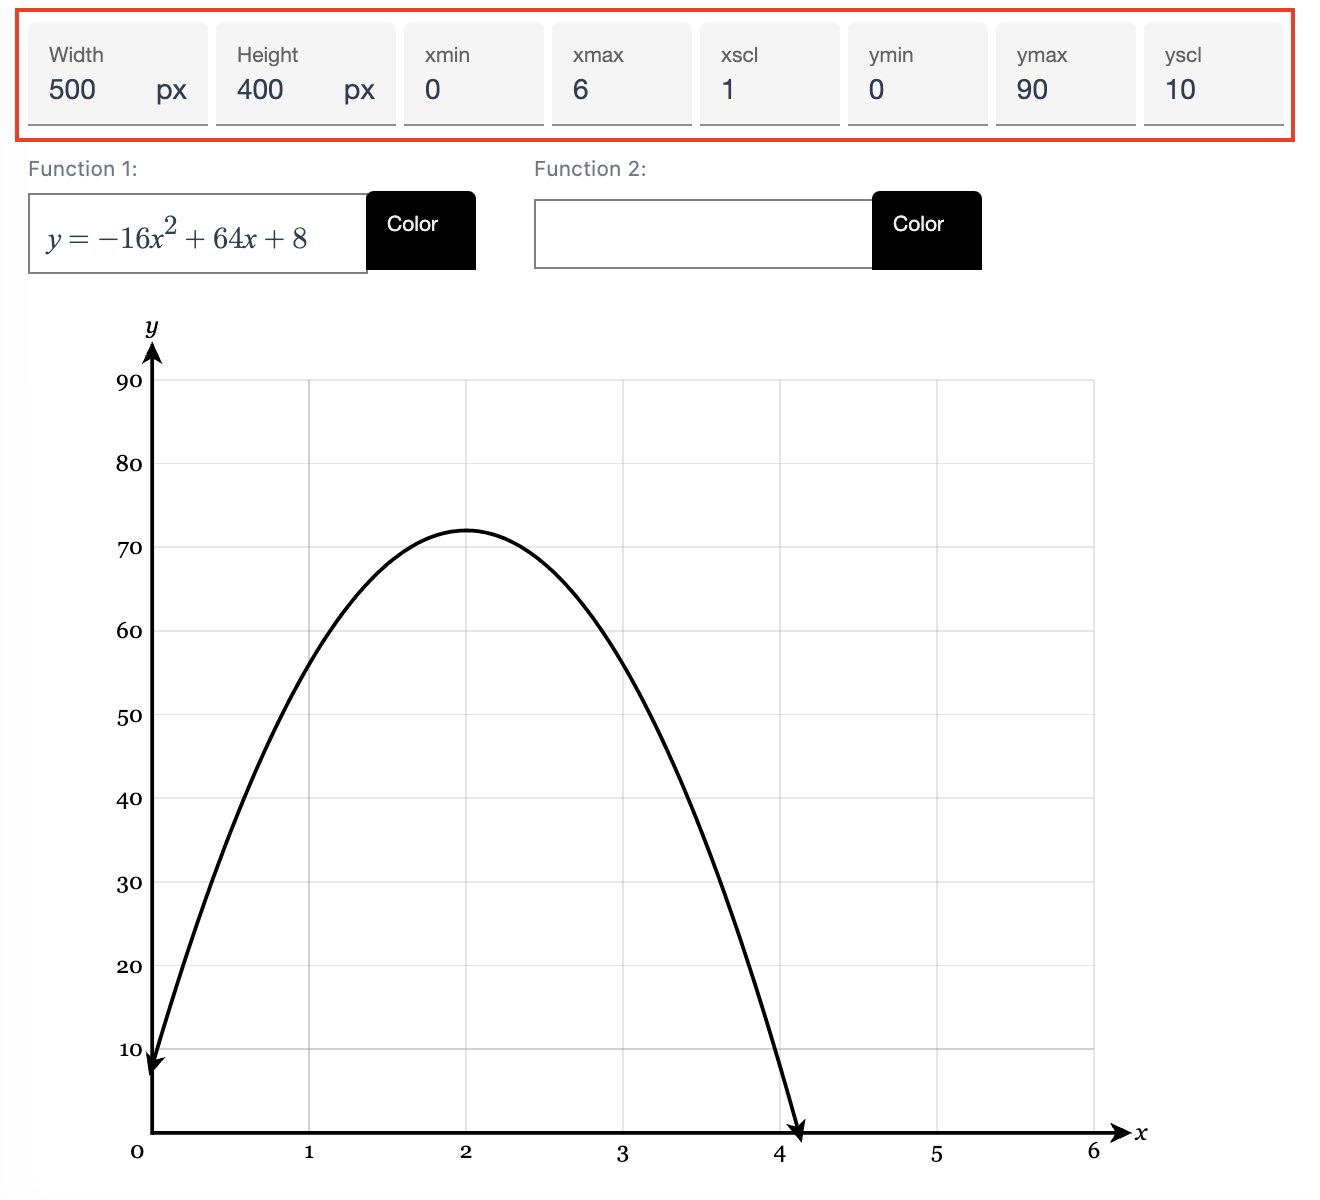
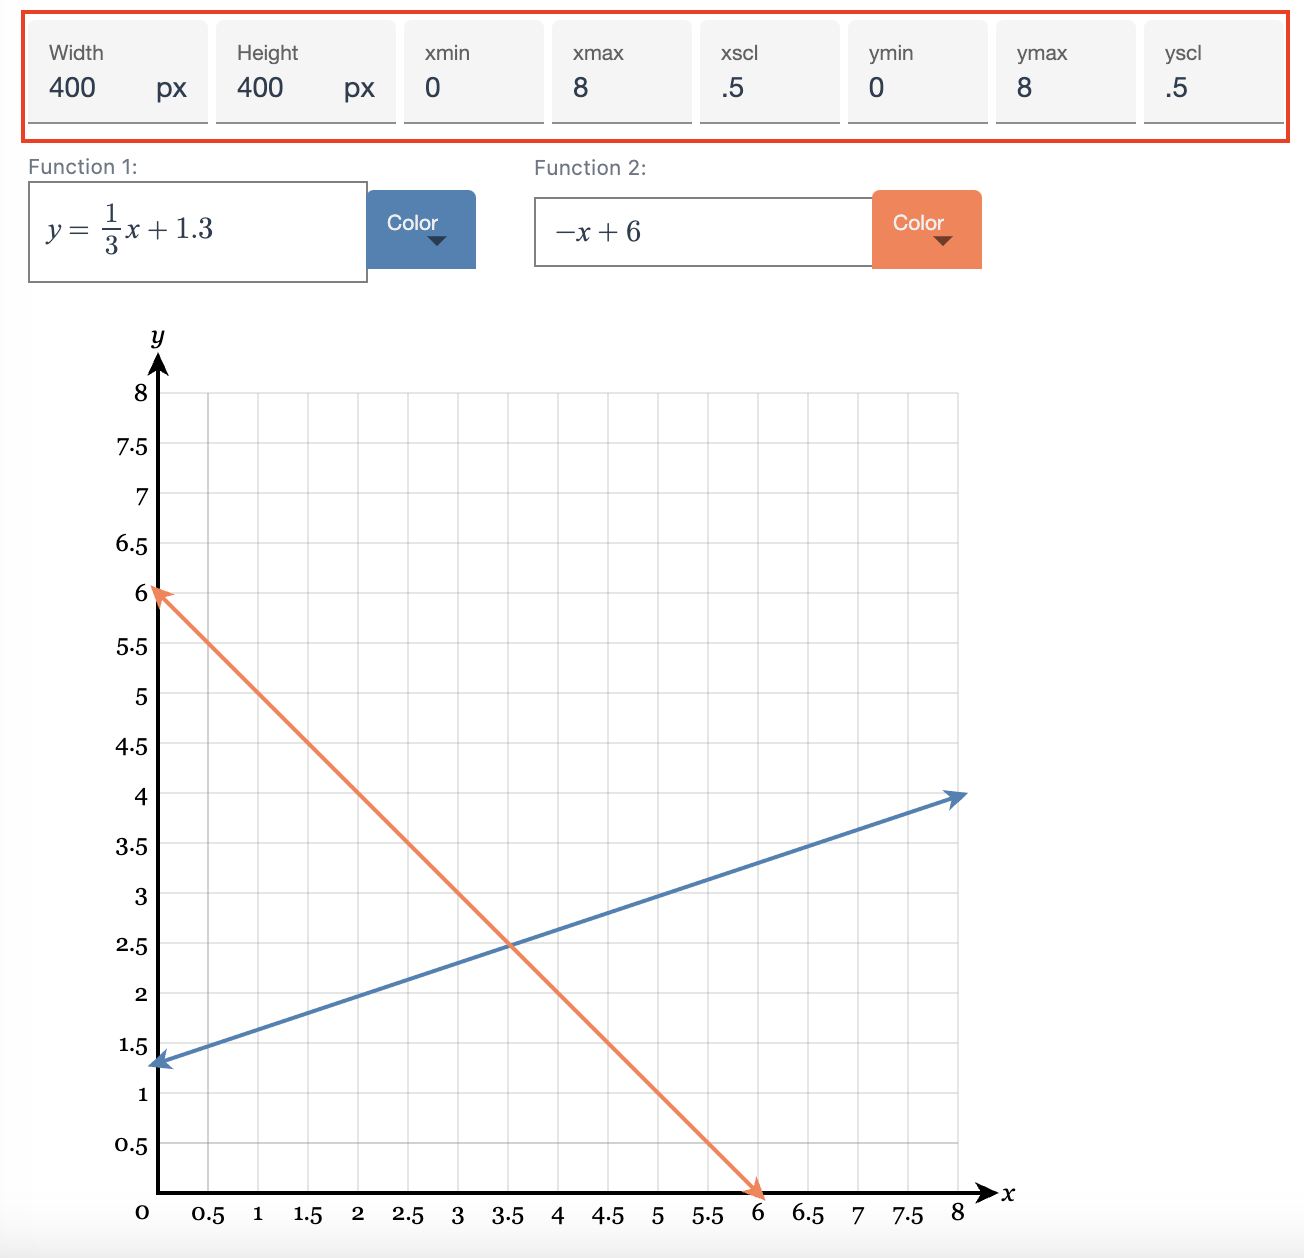
You can graph up to two equations at a time by entering them into the boxes for “Function 1” and “Function 2.”
By default, equations are graphed in black. To select a different color, use the “Color” drop-down menus to the right. |
 |
| Using the settings at the top, you can change the size, window, and scale of your graph. | 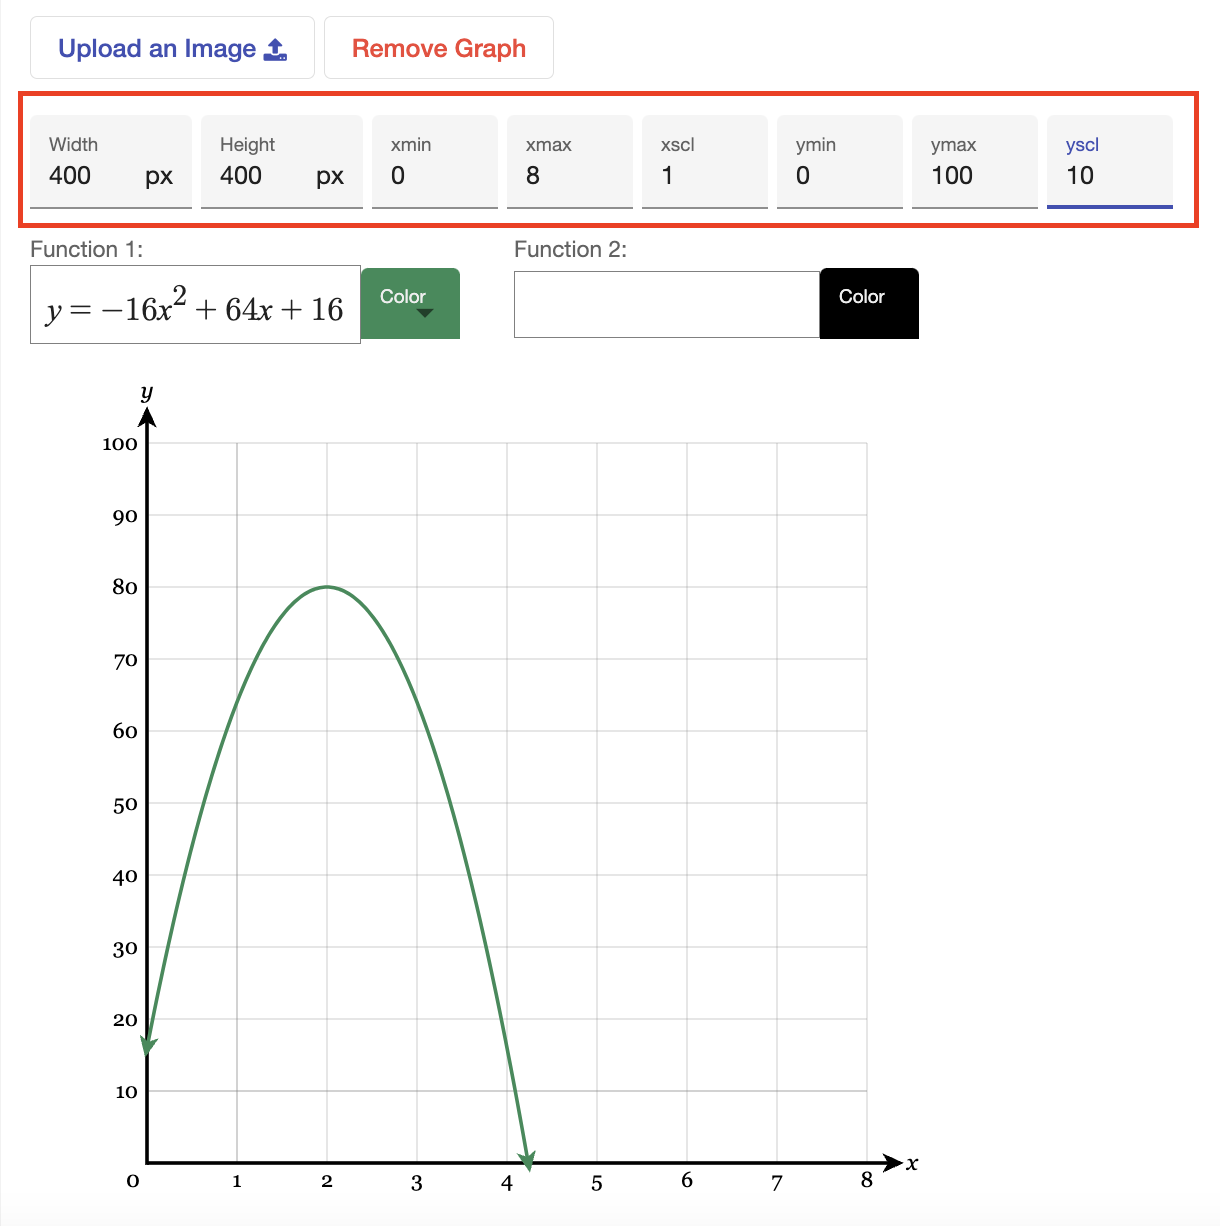 |
| The width and height settings allow you to resize your graph. | 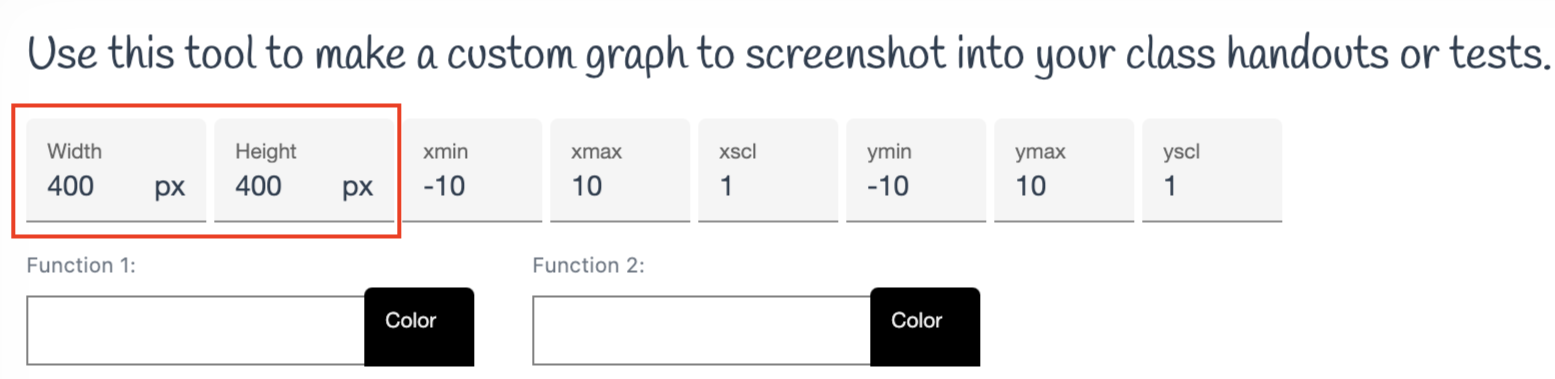 |
| The min and max settings determine the minimum and maximum values for the x- and y-axes, respectively. | 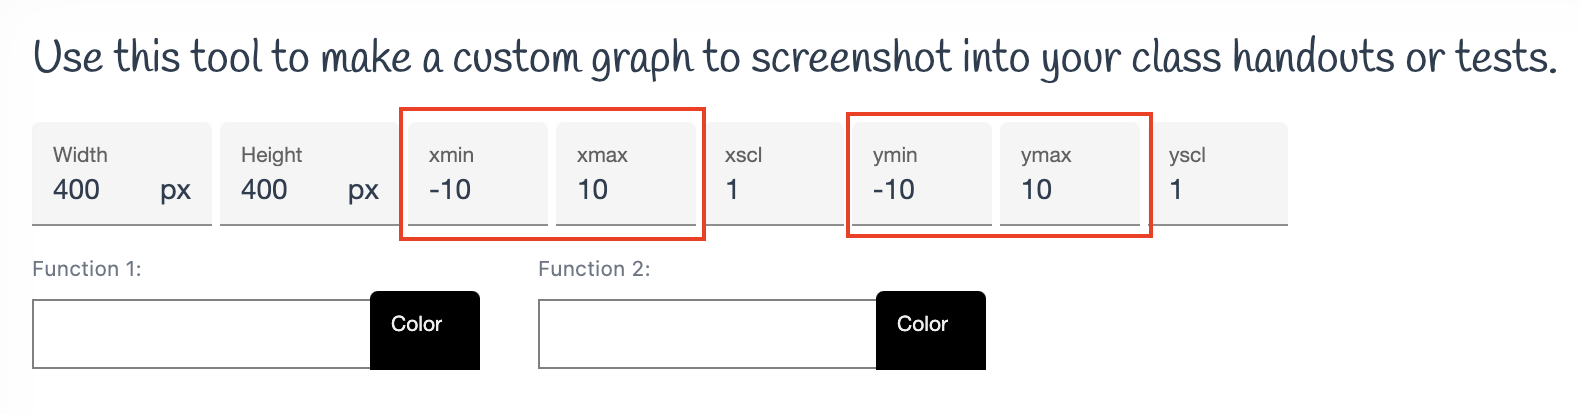 |
| The xscl and yscl settings allow you to adjust the scale of your x- and y-axes. Explore the examples below to see how you can adjust these settings to create graphs for your questions. | 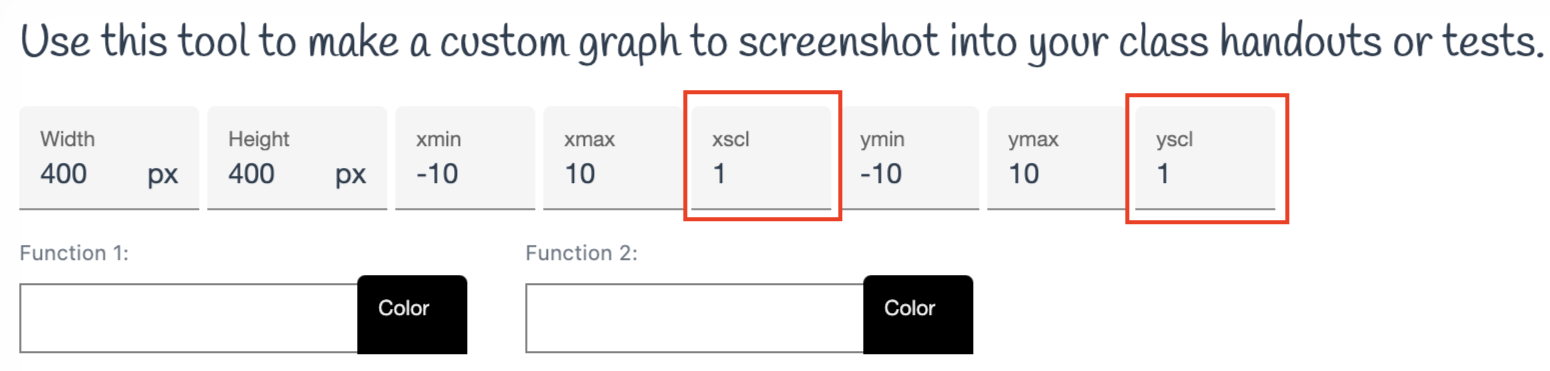 |
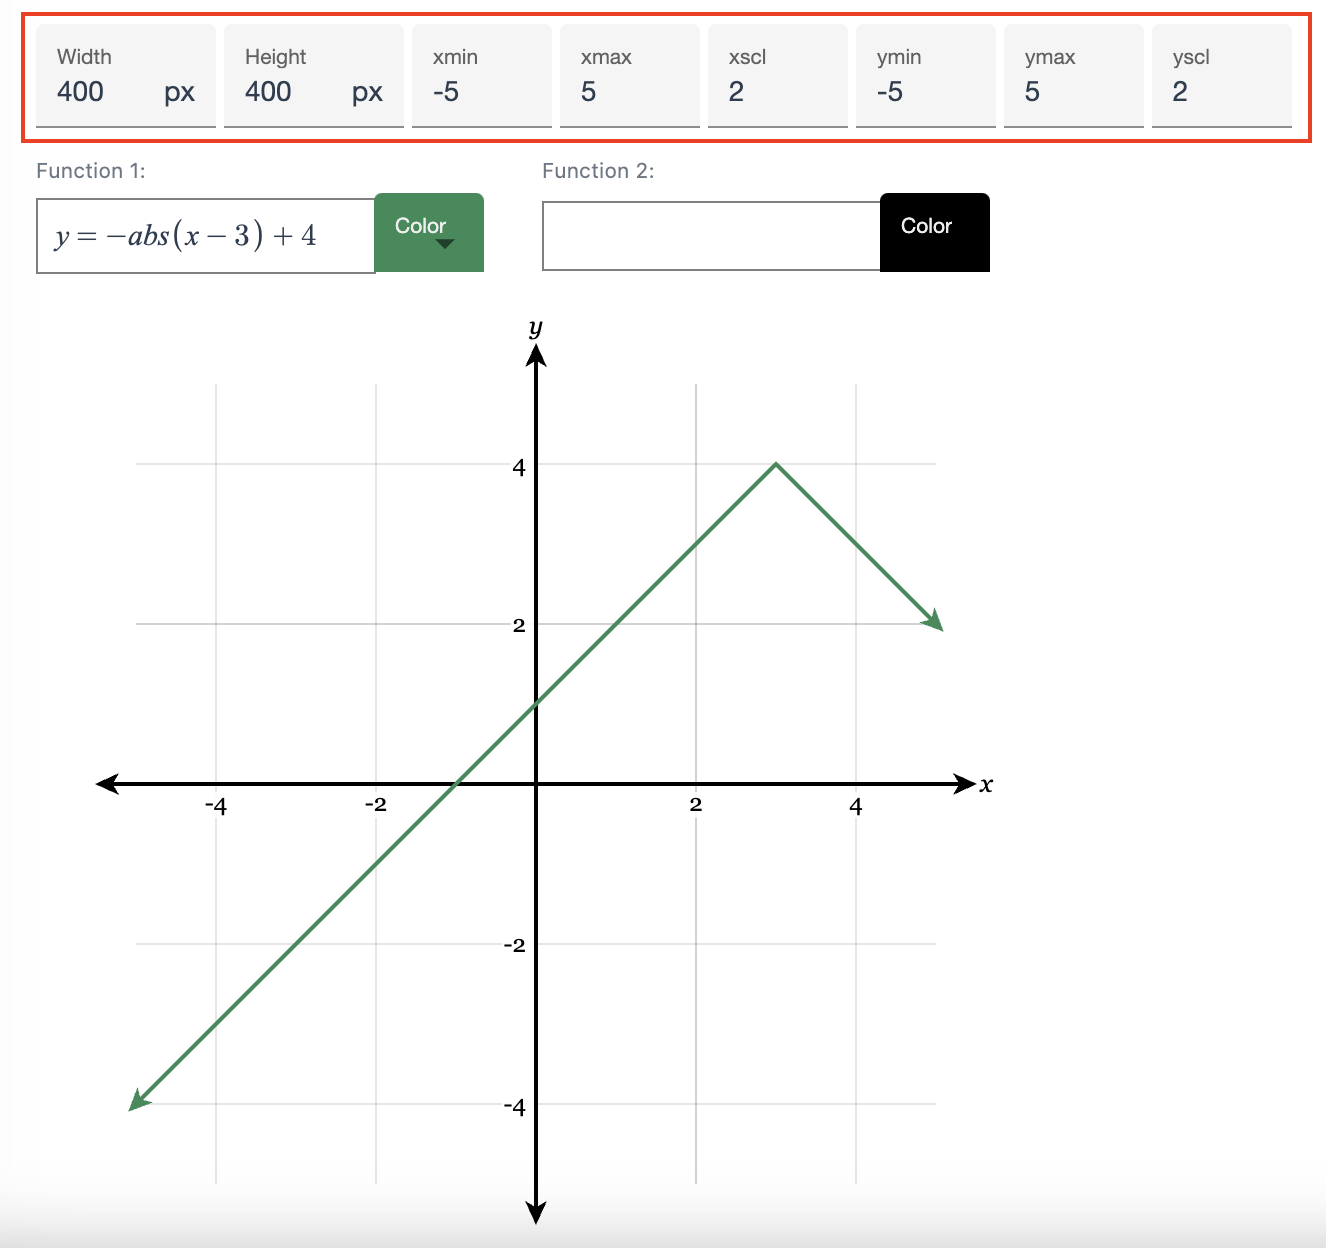
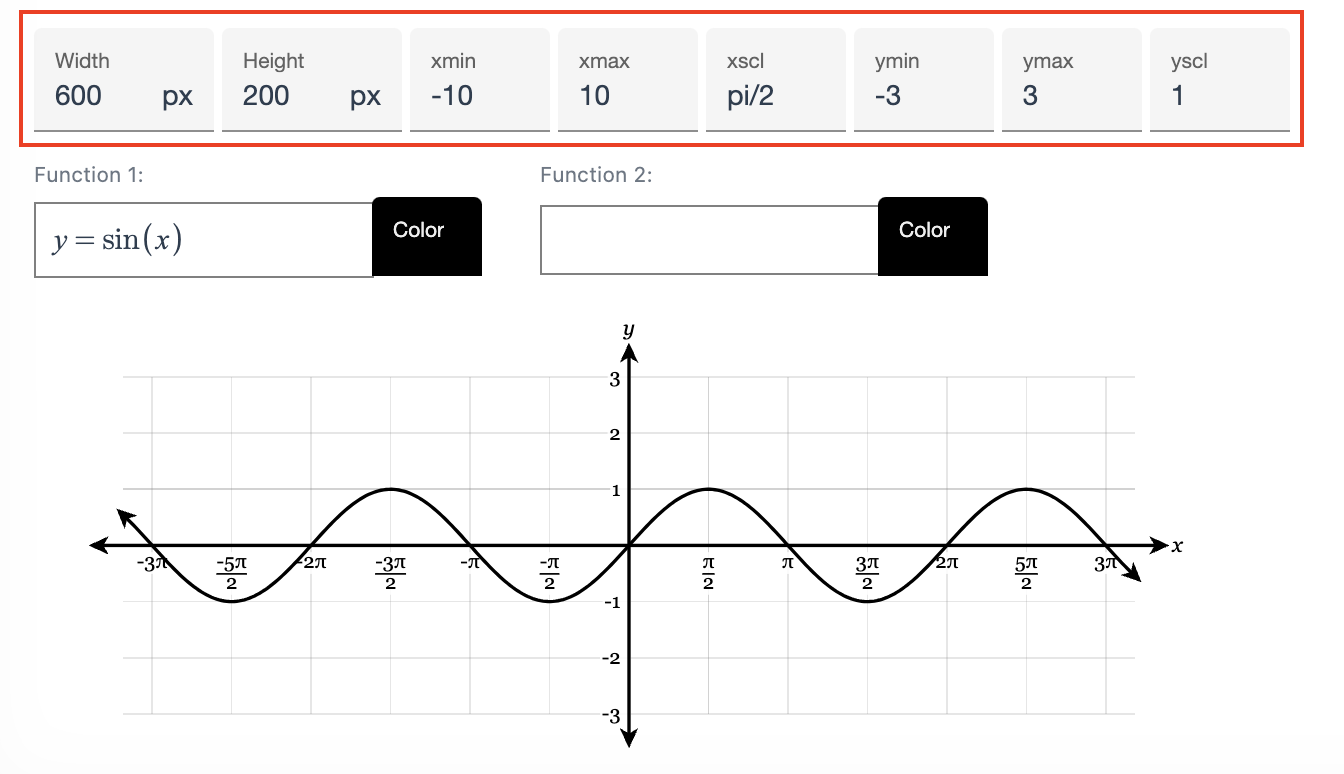
Graph Examples
Here are some example settings you can select to create different graphs.
 |
 |
 |
 |
| To remove the graph from your question, click the “Remove Graph” button at the top. | 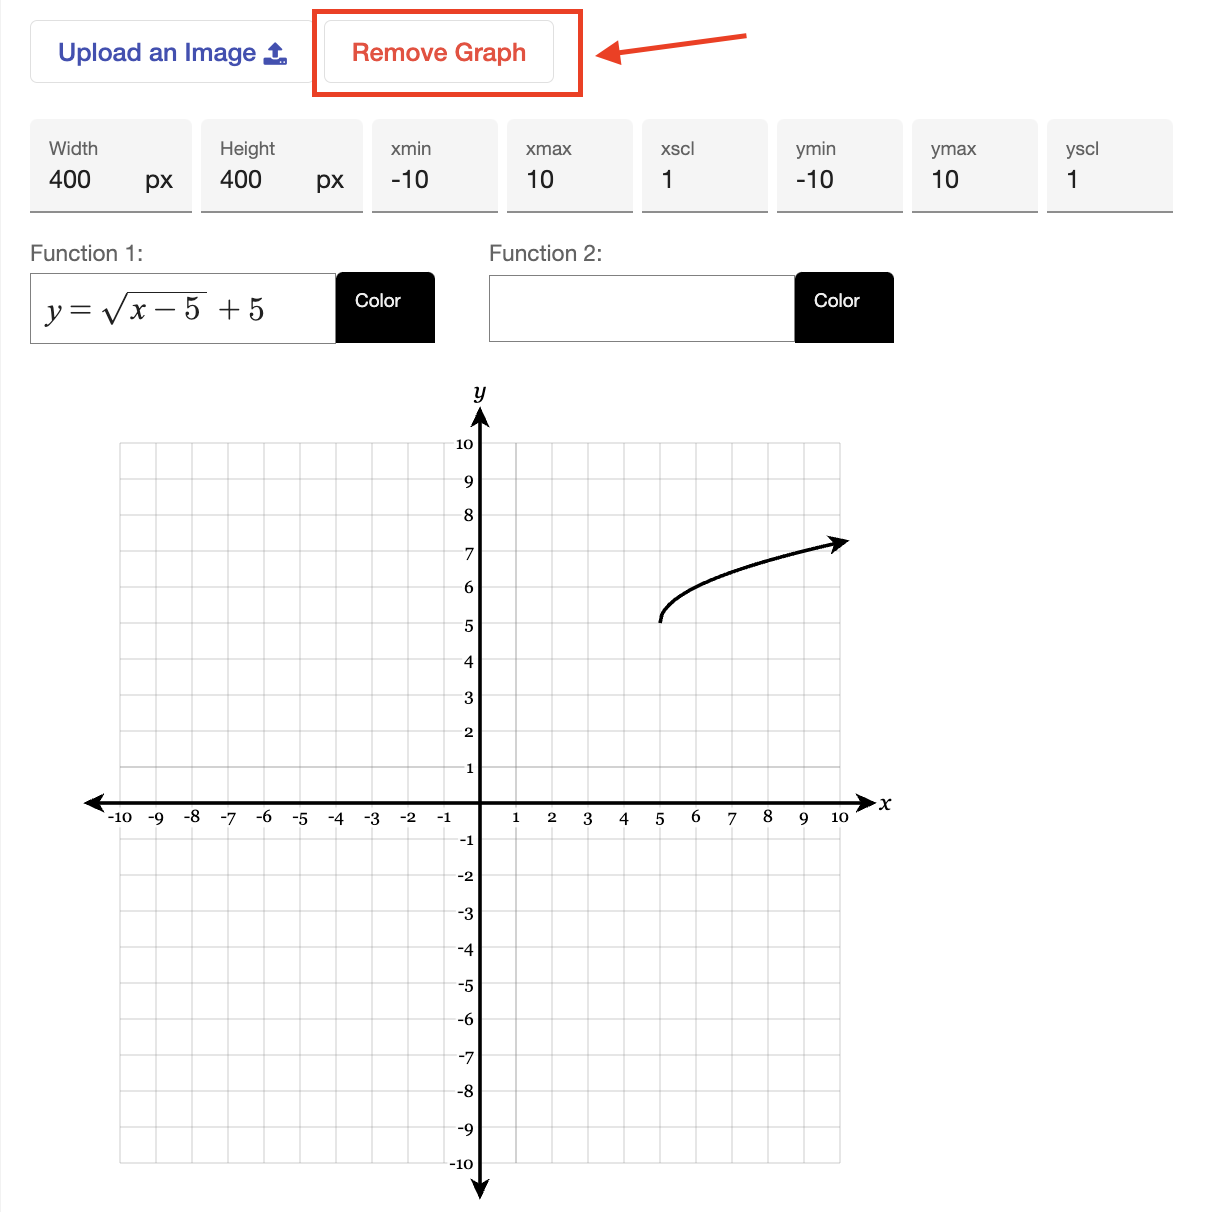 |
Add a Table
| Click “Add a table” to insert a table into your question. | 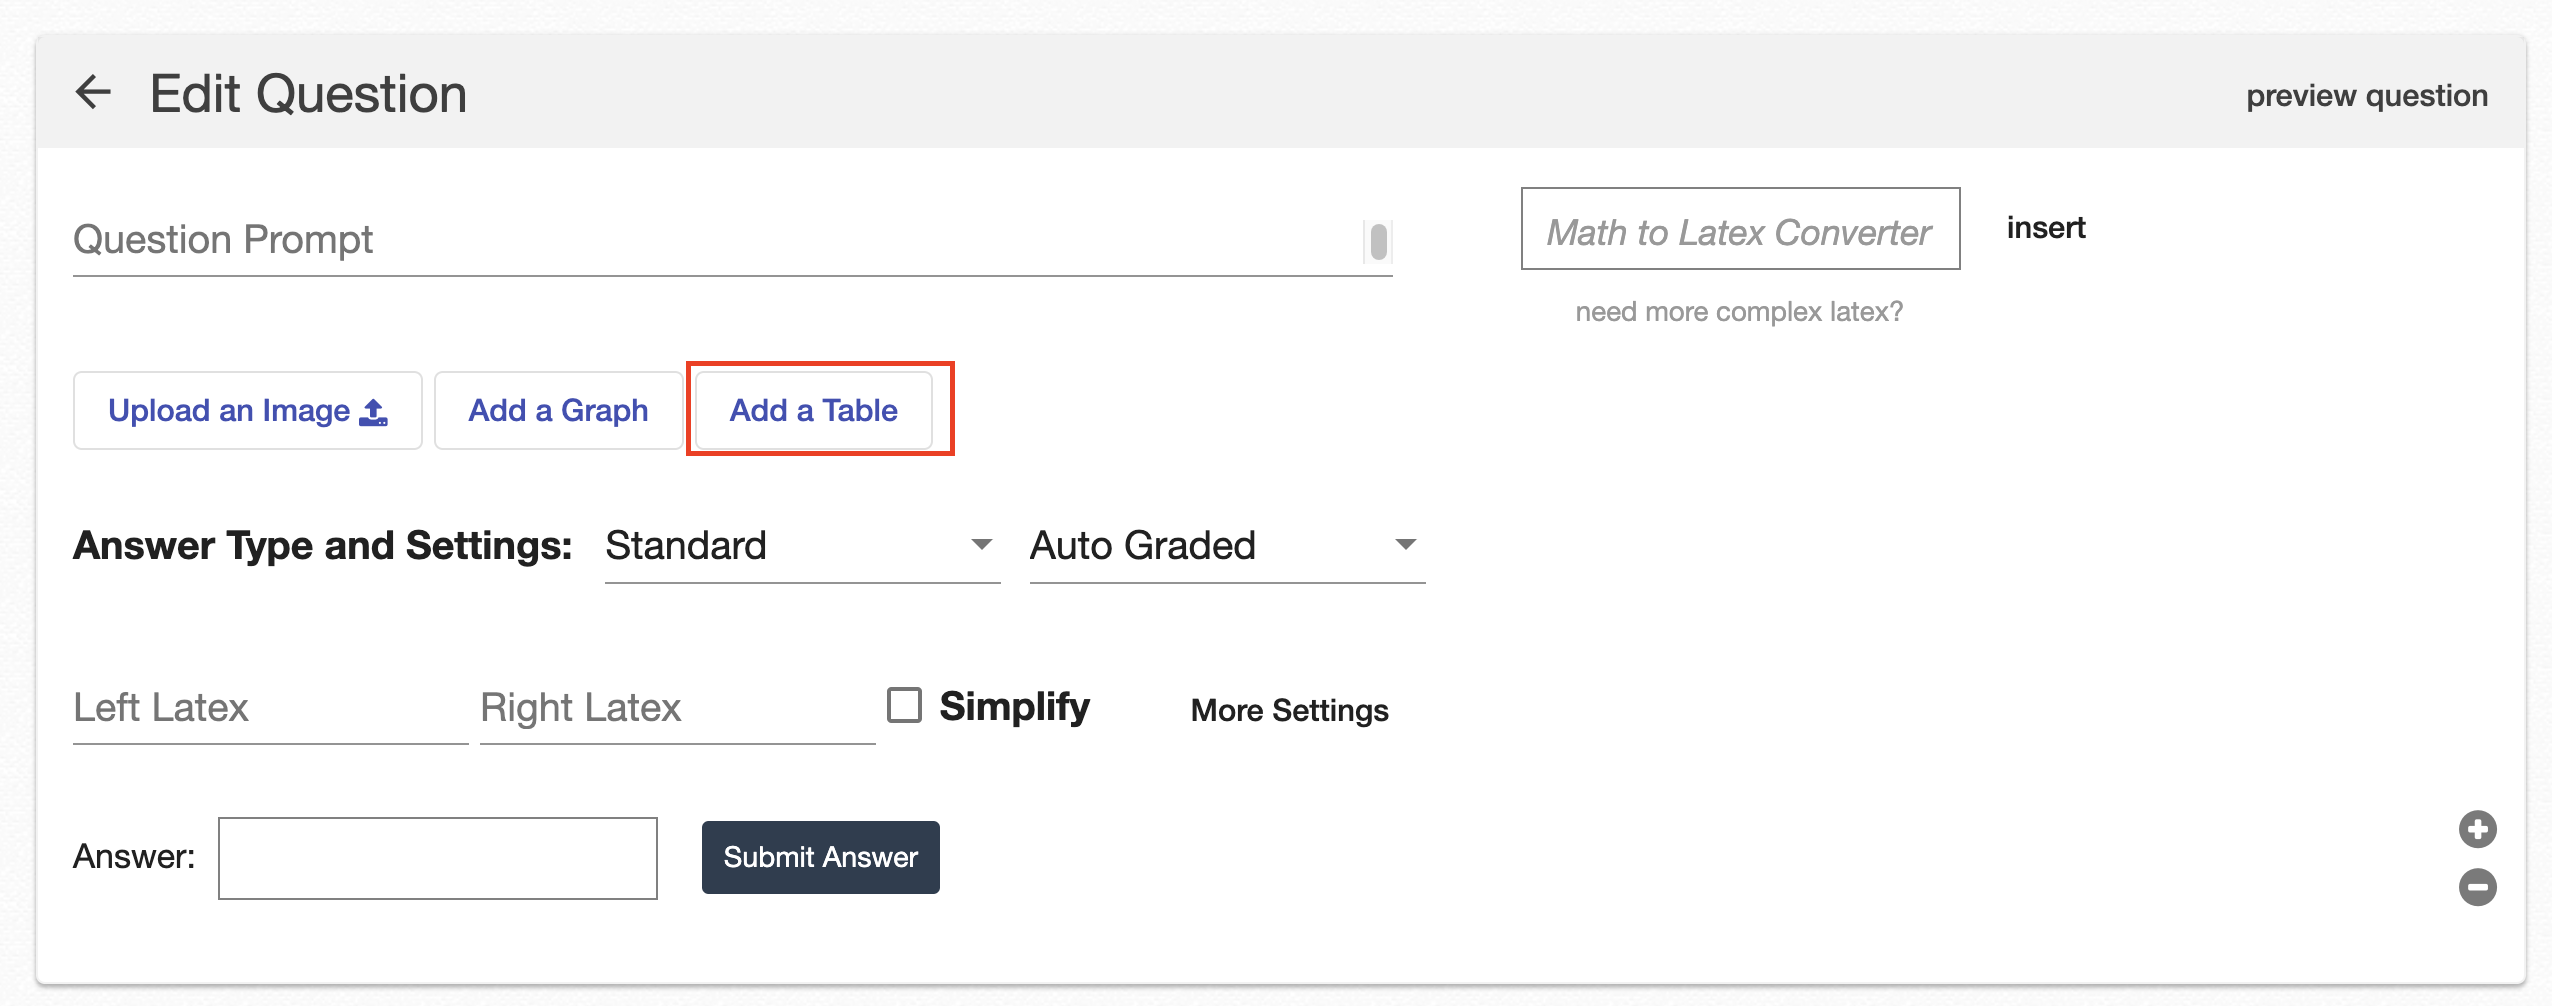 |
| You can adjust the number of rows or columns as needed. | 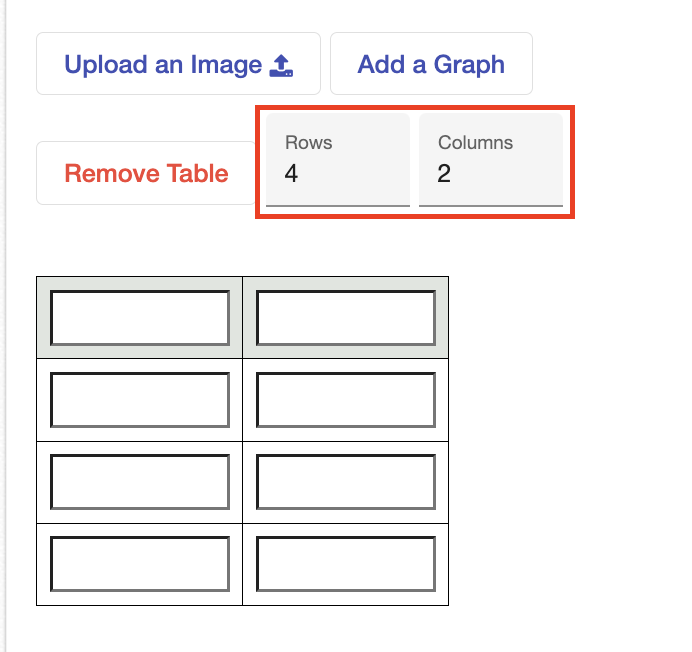 |
| You can also copy and paste LaTeX into your table as desired. | 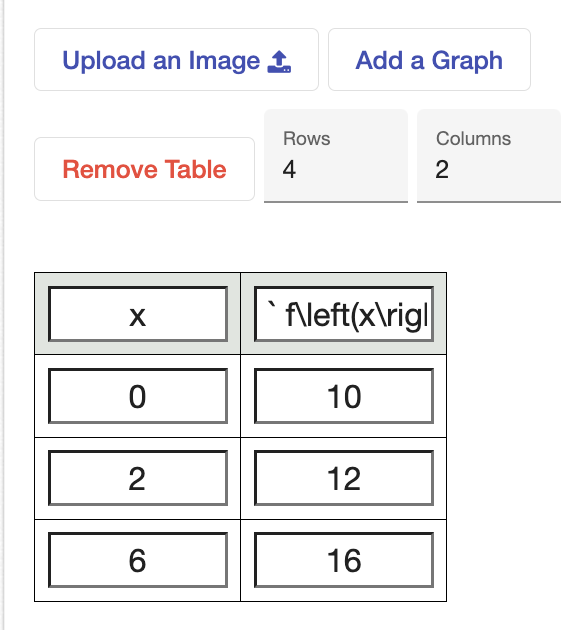 |
| To remove the table from your question, click “Remove Table.” | 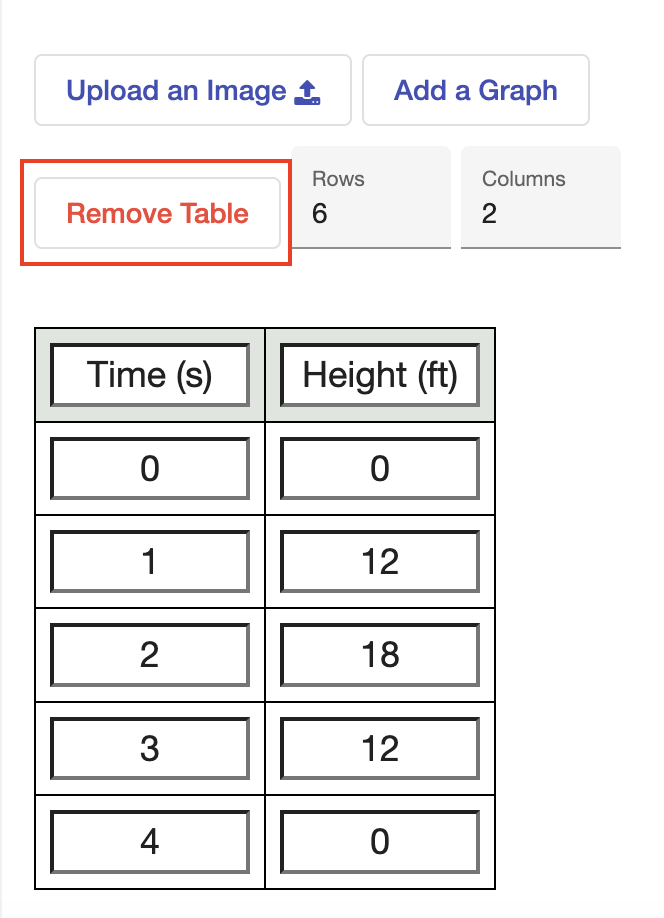 |
- images
- graphs
- tables
- equations
- latex
Was this article helpful?